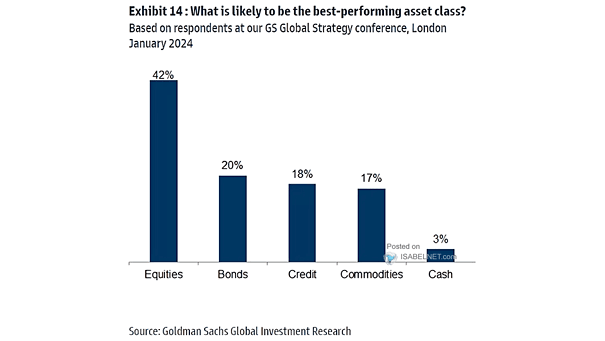
Performance – What Is Likely to Be the Best-Performing Asset Class?
Performance – What Is Likely to Be the Best-Performing Asset Class? Historically, equities have demonstrated significant growth and the potential for attractive returns over the long term. Will equities be the best-performing asset class in 2024? Image: Goldman Sachs Global Investment Research