Brent Price vs. 10-Year Treasury Bond Yield vs. S&P 500

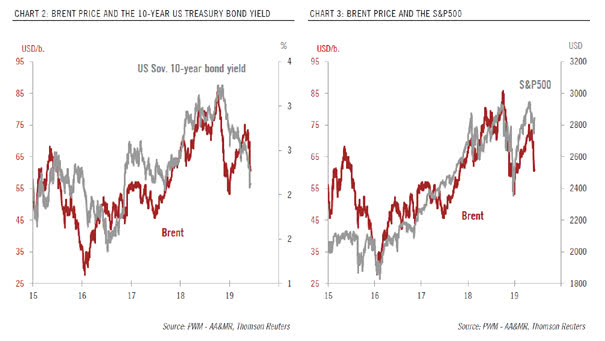
Brent Price vs. 10-Year Treasury Bond Yield vs. S&P 500 This chart shows that oil prices are a good indicator of global economic growth and investors are concerned about a global economic slowdown. Image: Pictet Wealth Management
Short-term Pessimism Almost as Extreme as December

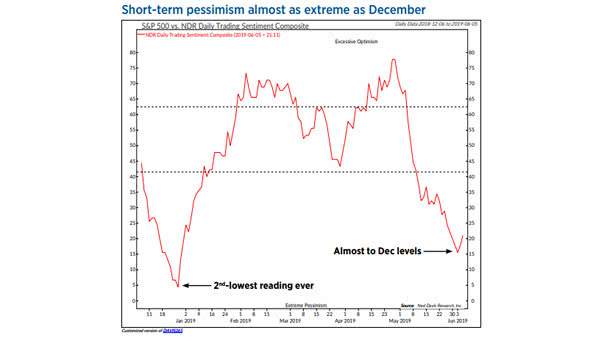
Short-term Pessimism Almost as Extreme as December The trade war and tariffs scared the stock market. Short-term pessimism is generally a good contrarian indicator, especially at a time when the media seem to be worried about the market. Image: Ned Davis Research

Lower Returns for Stocks in the Next 12 Months?

Lower Returns for Stocks in the Next 12 Months? Morgan Stanley’s cyclical indicator is flagging “downturn.” The yield curve’s slope, debt issuance, consumer confidence, economic and financial markets data are aggregated in Morgan Stanley’s cyclical indicator. The entry into the “downturn” phase suggests lower returns for stocks and risky assets in the next 12 months. Image:…

US Yield Curve Inversions since 1966

US Yield Curve Inversions since 1966 Currently, investors are concerned about yield curve inversions, because they have been a indicator of a coming recession. But not all inversions are the same. If the yield curve inversion is due to 10-year falling, then it is a “risk-off” trade, and not an economic cycle turn. This great chart…

The Ability of U.S. Companies to Service their Debt is Good

The Ability of U.S. Companies to Service their Debt is Good In recent history, this chart suggests that poor ability of U.S. companies to service their debt leads to recession. That’s not the case today. This indicator suggests that there is no imminent recession on the horizon.

What Does M1 Money Supply Growth Tell Us About the Next Recession?

What Does M1 Money Supply Growth Tell Us About the Next Recession? M1 is the money supply that includes types of money commonly used for payment, basically currency outside banks and checking account balances. This is not the perfect recession indicator, but in recent history, it turns negative at least one year before a recession.

Stock Market Forecasting Models

SELECT A STOCK MARKET FORECASTING MODEL STOCK MARKET VALUATION STOCK MARKET SHORT-TERM FORECAST STOCK MARKET EQUITY RISK PREMIUM STOCK MARKET EQUITY RISK PREMIUM STOCK MARKET BULL AND BEAR INDICATOR STOCK MARKET FORECASTING MODELS VS. US STOCK MARKET 97% CORRELATION, R² = 0.94 SINCE 1970 RECESSION INDICATORS LEADING INDICATORS

“U.S. Stock Market, No Froth In Sight” Says Stock Market Sentiment Index

“U.S. Stock Market, No Froth In Sight” Says Stock Market Sentiment Index Keep in mind that it is just another investor sentiment tool. But it does not show at all if the US stock market is overvalued or undervalued. See our stock market valuation model (99% correlation and R² = 0.97 since 1970).

Is Inflation Dead?

Is Inflation Dead? Is this cover of Bloomberg Businessweek a contrarian indicator? Remember that dinosaurs evolved into birds over 50 million years. Do you think we will have to wait 50 million years for inflation to return? You may also like “How to Get Inflation?” and “Where Does Inflation Come From?“ Image: Bloomberg