Should Investors Be Concerned About Rising Oil Prices?

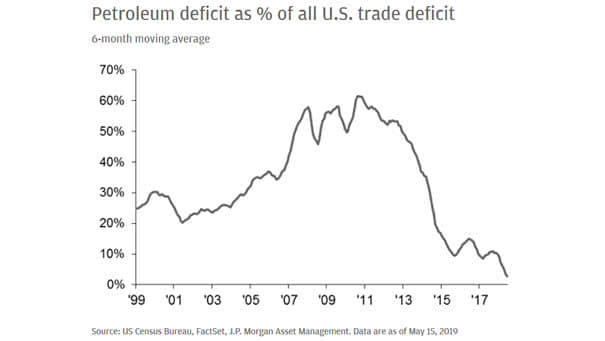
Should Investors Be Concerned About Rising Oil Prices? Because the U.S. becomes entirely self-sufficient, it helps to contain oil prices in the long-term. Cheap oil is good for global economic growth, business and consumers. Image: J.P. Morgan Asset Management

10-Year Treasury minus 1-Year Treasury Yield Spread vs. S&P 500 Returns

10-Year Treasury minus 1-Year Treasury Yield Spread vs. S&P 500 Returns If history helps us to predict the future, the 10y-1y treasury yield spread suggests low returns ahead for U.S. stocks. After 10 years of a bull market, our stock market forecasting model also shows that the market follows a different path in 2019. Statistically,…

QE to Infinity and Beyond?

QE to Infinity and Beyond? Analysts say the Fed will resume and buy “just” U.S. Treasuries next year. The Fed’s balance sheet should rise past its historic peak. Image: Bloomberg – Cartoon: Hedgeye Risk Management LLC

The Trade-Weighted Broad US Dollar Index Hits the Highest Level since 2002

The Trade-Weighted Broad US Dollar Index Hits the Highest Level since 2002 A strong dollar leads to wider trade deficits, and this is a headwind for US exporters. A strong dollar can also hurt emerging markets. The trade-weighted broad US Dollar index is a weighted average of the foreign exchange value of the US dollar against…

Are Value Stocks Cheap or Expensive?

Are Value Stocks Cheap or Expensive? Value stocks usually trade at a 24% discount to the stock market.But as of 02/29/2019, they are trading at 31% discounts in the U.S., 33% discounts in Europe and 34% discounts in emerging countries. Image: GMO

More than 200 Years of US Interest Rates in One Chart

More than 200 Years of U.S. Interest Rates in One Chart This long term chart covers more than two centuries of US interest rates (yield on the U.S. 10-year Treasury). Image: Goldman Sachs Global Investment Research Click the Image to Enlarge

Gold Has Crushed the S&P 500 So Far Since 2000

Gold Has Crushed the S&P 500 So Far Since 2000 Gold has returned a great 345.30 percent, while the S&P 500 has returned 146.57 percent since 2000. Keep in mind that Gold has beaten the US stock market over multiple time periods Historically, Gold has also had a strong negative correlation with the US stock…

Lumber Prices Are a Great Leading Indicator of Future Earnings

Lumber Prices Are a Great Leading Indicator of Future Earnings This chart suggests that lumber prices give a good forecast of where the stock market is going. When lumber prices fall over a 12-month period, then EPS follows 6 months later. Although there is no immediate recession on the horizon, a market downturn is possible. Image:…

Concentration of Stock Ownership by Wealth Bracket

Concentration of Stock Ownership by Wealth Bracket As the chart shows, the top 20% wealthiest American households own over 93% of stocks. You may also like “How the Composition of Wealth Changes from the Middle Class to The Ultra Rich?” and “U.S. Net Worth by Wealth Bracket.” Image: Visual Capitalist