Commodities and Baltic Dry Index
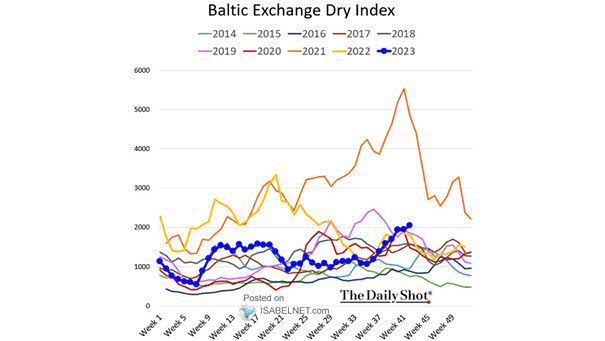
Commodities and Baltic Dry Index Can the Baltic Dry Index, which is commonly used as a proxy for global economic growth, indicate a potential recovery in the global economy? Image: The Daily Shot
Commodities and Baltic Dry Index Can the Baltic Dry Index, which is commonly used as a proxy for global economic growth, indicate a potential recovery in the global economy? Image: The Daily Shot
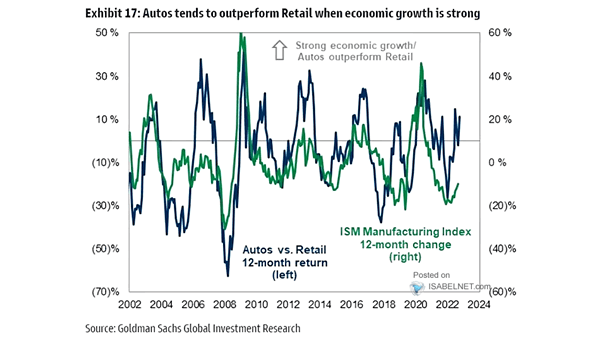
ISM Manufacturing Index and Autos vs. Retail When there is robust economic growth, it is generally expected that the autos sector would outperform the retail sector. Image: Goldman Sachs Global Investment Research

ISM Manufacturing Index vs. U.S. HY – IG Spread The ISM Manufacturing Index in contraction is a sign of a potential recession, while the tight U.S. HY/IG spread suggests continued positive growth. Image: BofA Global Investment Strategy
S&P 500 Return vs. Modeled Price Based on Nine Flow Variables Goldman Sachs expects the S&P 500’s growth potential to be limited, as S&P 500 daily returns are typically linked with inflows. Image: Goldman Sachs Global Investment Research
U.S. Labor Market – Net Job Gains Job growth in the United States is expected to slow significantly in 2023 compared to 2022. Image: Goldman Sachs Global Investment Research
S&P 500 Dividends per Share Goldman Sachs expects a 10-year compound annual growth rate of 7% for S&P 500 dividends. Image: Goldman Sachs Global Investment Research
S&P 500 Index vs. M2 Money Supply Global M2 money supply growth has a significant impact on U.S. stocks. Image: Morgan Stanley Wealth Management
U.S. GDP vs. Current Activity Indicator Goldman Sachs expects U.S. GDP growth of 1.7% in 2023. Image: Goldman Sachs Global Investment Research
Earnings – Corporate Sentiment vs. Quarterly EPS YoY (Leading Indicator) Corporate sentiment tends to lead earnings growth by 3 months, suggesting earnings downside risk. Image: BofA Global Research
Real U.S. Average Hourly Earnings and Recessions Is a recession likely in the United States if real wage growth remains negative by summer? Image: BofA Global Investment Strategy