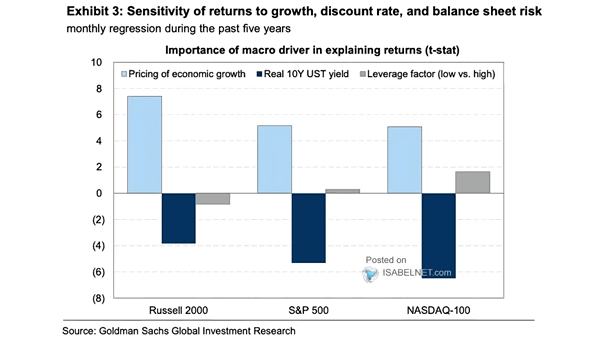
Importance of Macro Driver in Explaining Returns

Importance of Macro Driver in Explaining Returns Higher real 10-year UST yields can potentially lead to a decrease in U.S. stock returns, but other factors should also be considered. Image: Goldman Sachs Global Investment Research
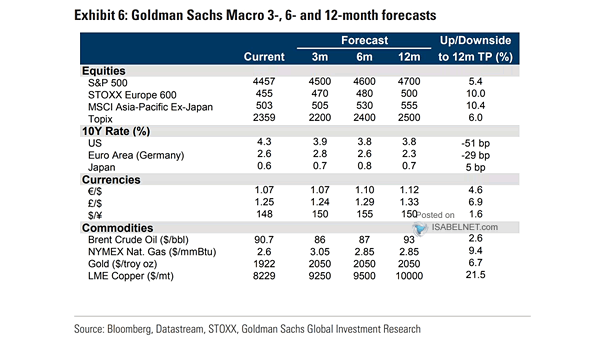
Macro Forecasts

Macro Forecasts Goldman Sachs predicts that the S&P 500 will reach 4,700 and the 10-year U.S. Treasury yield will be at 3.8% in 12 months. Image: Goldman Sachs Global Investment Research

CRB Raw Industrials to Gold Ratio

CRB Raw Industrials to Gold Ratio Does the CRB raw industrials index to gold ratio suggest higher 10-year UST yields? Image: BCA Research

S&P 500 DDM-Implied Fair Value

S&P 500 DDM-Implied Fair Value Goldman Sachs forecasts the U.S. 10-year Treasury yield at 1.6% by the end of 2021 and the S&P 500 to reach 4,700 (base case scenario). Image: Goldman Sachs Global Investment Research

Outlook for Portfolio Returns Over the Next 10 Years

Outlook for Portfolio Returns Over the Next 10 Years Chart suggesting anemic returns over the next 10 years, due to low yields, low growth and low inflation expectations. Image: Morgan Stanley Research

U.S. 60/40 Portfolio Returns Over the Next 10 Years

U.S. 60/40 Portfolio Returns Over the Next 10 Years Chart suggesting that the return of a U.S. 60/40 portfolio could slide near 100-year lows over the next decade, due to low yields, low growth and low inflation expectations. Image: Morgan Stanley Research

S&P 500 Valuation and Equity Risk Premium

S&P 500 Valuation and Equity Risk Premium This chart shows that the equity risk premium (earnings yield less 10-year Treasury yield) has declined to 3.9%. Image: Fidelity Investments

U.S. Monthly Average 30-Year Fixed Mortgage Rates

U.S. Monthly Average 30-Year Fixed Mortgage Rates Keep in mind that mortgage costs are influenced by the 10-year Treasury yield. 30-year mortgage rates = 1.739 x (10-year treasury yield)² + 0.7755 x (10-year treasury yield) + 0.0227(R² = 0.9787) You may also like “30-Year Mortgage Rates vs. 10-Year Treasury Yield.” Image: Leonard Kiefer

The Secular Trend for U.S. Interest Rates

The Secular Trend for U.S. Interest Rates This nice chart shows the U.S. 10-year Treasury yield against the natural rate (nominal R-Star) and monetary velocity. In a sense, it explains the secular trend for U.S. interest rates. Image: Fidelity Investments

More than 200 Years of US Interest Rates in One Chart

More than 200 Years of U.S. Interest Rates in One Chart This long term chart covers more than two centuries of US interest rates (yield on the U.S. 10-year Treasury). Image: Goldman Sachs Global Investment Research Click the Image to Enlarge