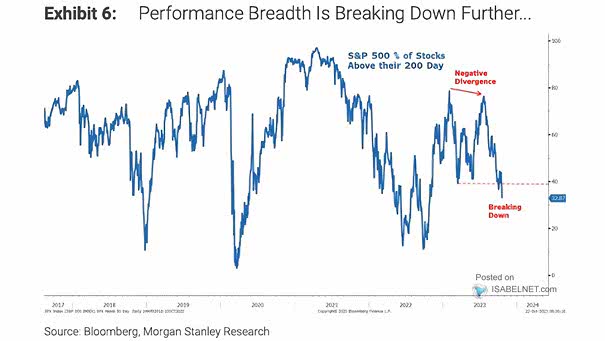
Financials vs. S&P 500 and U.S. 10-Year Treasury Yields

Financials vs. S&P 500 and U.S. 10-Year Treasury Yields The relative performance of U.S. banks tends to track U.S. 10-year Treasury rates. Rising bond yields would be good news for financial stocks. Image: Topdown Charts

Tech Stocks – FAAMG vs. S&P 500

Tech Stocks – FAAMG vs. S&P 500 Are investors too complacent about antitrust risks? China’s anti-monopoly actions erased China Tech stock outperformance in just two months. Image: Goldman Sachs Global Investment Research

Top 5 vs. S&P 500 ex-Top 5 – YoY Contribution of EPS and P/E to Returns

Top 5 vs. S&P 500 ex-Top 5 – YoY Contribution of EPS and P/E to Returns The performance gap could widen further, as the top 5 largest stocks in the S&P 500 are superior on almost every financial metric (revenue, profit growth, margin structure, volatility and corporate leverage). Image: Credit Suisse Research

S&P 500 – S&P 5 vs. S&P 495

S&P 500 – S&P 5 vs. S&P 495 This chart highlights the outperformance of the biggest five companies in the S&P 500 vs. the remaining 495 stocks. Image: BCA Research

S&P 500 Return Attribution Past 5 Years

S&P 500 Return Attribution Past 5 Years The performance of the S&P 500 is largely driven by stocks in the technology and e-commerce sectors. Image: BofA Research Investment Committee