Market Cycle Back Tested over the Years
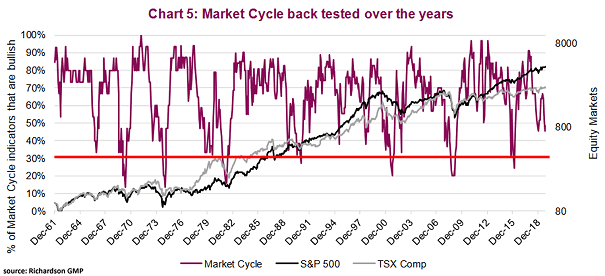
Market Cycle Back Tested over the Years Chart suggesting that the end of a bull market often occurs when the percentage signals that are bullish fall to 30% or below. Image: Richardson Wealth
Market Cycle Back Tested over the Years Chart suggesting that the end of a bull market often occurs when the percentage signals that are bullish fall to 30% or below. Image: Richardson Wealth
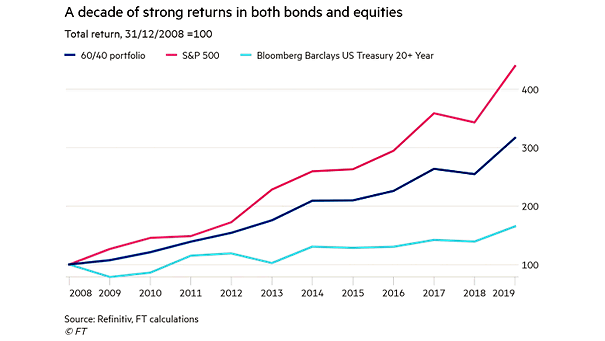
Total Return since 2008: 60/40 Portfolio, S&P 500 and U.S. Treasury 20+ Year The current bull market began 10 years ago, but the next 10 years could be very different. Image: Financial Times

Long-Term U.S. Dollar Cycles This chart shows bear and bull cycles in the U.S. dollar. Will the U.S. dollar enter a bear market? Image: Alpine Macro
S&P 500 2020 Target Models BofAML is bullish. The official S&P 500 2020 estimate is 3,300. Image: BofA Merrill Lynch US Equity & US Quant Strategy
S&P 500 Index and UBS Weighted Global Growth Surprise Index The divergence between the S&P 500 Index and the global growth surprise index could explain why this bull market is so hated. Image: Swedbank Research
S&P 500 and Margin Debt Margin debt has still not recovered from last December’s lows. Usually, it is mostly bullish for stocks, because investors are still fearful. Image: Merk Investments
S&P 500 Valuation This chart shows that the S&P 500 is in a trading range rather than in a bearish or bullish market trend, for more than 20 months. Image: Fidelity Investments
Dow Jones Industrial Average Around Second Fed Rate Cut This chart shows that a second rate cut has been bullish. On average, the Dow Jones Industrial Average has gained 19% over the next 12 months. Image: Ned Davis Research
Sentiment Indicator Are investors be too bullish? Currently, the sentiment indicator is above average at 1.2 standard deviations. Image: Goldman Sachs Global Investment Research
MSCI All Country World Index (ACWI) – Period of Consolidation Exane is bullish and suggests that the MSCI ACWI might be nearing an end to this period of consolidation. Image: Exane BNP Paribas