Passive Equity Fund Assets vs. Active
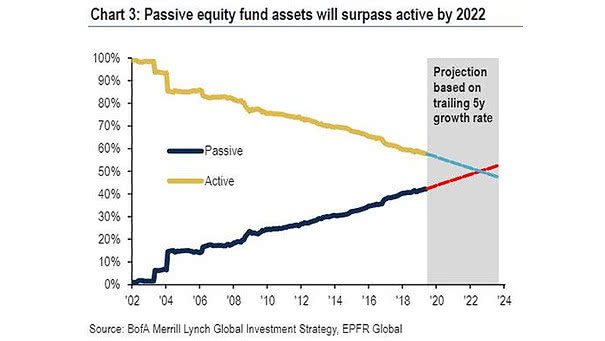
Passive Equity Fund Assets vs. Active Record passive inflows suggest passive equity funds will surpass active by 2022. Image: BofA Merrill Lynch
Passive Equity Fund Assets vs. Active Record passive inflows suggest passive equity funds will surpass active by 2022. Image: BofA Merrill Lynch
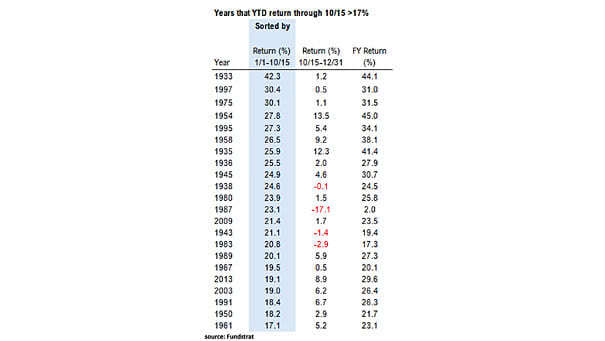
S&P 500 Performance When Market Is Up 17% Through Oct. 15 When the S&P 500 is up 17% through October 15, the average gain through year-end is 3.1%, 82% of time since 1930. Image: Fundstrat Global Advisors, LLC

Current 20-Month Flat Market vs. Major S&P 500 Tops Since World War II, the U.S. stock market went nowhere three times in the last 20 months. If history repeats itself, it could make an upside breakout. Image: Fundstrat Global Advisors, LLC
Cumulative Fund Flows: Global Equities and Global Government & Corporate Bonds $339 billion in inflows to bond funds globally, and $208 billion in outflows from global equity funds in 2019, as investors fear a global recession is on the horizon. Image: BofA Merrill Lynch
Number of Fed Rate Hikes/Cuts Expected Over Next 12 Months Fed funds futures imply two further rate cuts over the next 12 months. Image: Credit Suisse Research
VIX Term Structure Inversion This great chart suggests that the VIX term structure inverting is often associated with an imminent low and an average gain of 8.9% over 6 months (since 2016). Image: Fundstrat Global Advisors, LLC
Comparative Return of Bitcoin and S&P 500 This chart suggests that the best years for Bitcoin are when the S&P 500 is above 15%. Image: Fundstrat Global Advisors, LLC
Hedge Fund Equity Exposure Great chart showing that hedge funds’ equity exposure is near their lowest since the global financial crisis. Image: J.P. Morgan
Global Bond Fund Flows Over the past 3 months, investors have injected $160bn into bond funds, fearing a global recession. Image: BofA Merrill Lynch
Demographics – Dow Jones and Generational Peaks This chart shows that generational peaks are associated with major market tops. GenX peaked in 2018 and Millennials don’t peak until 2038. Image: Fundstrat Global Advisors, LLC