GLD Gold Holdings

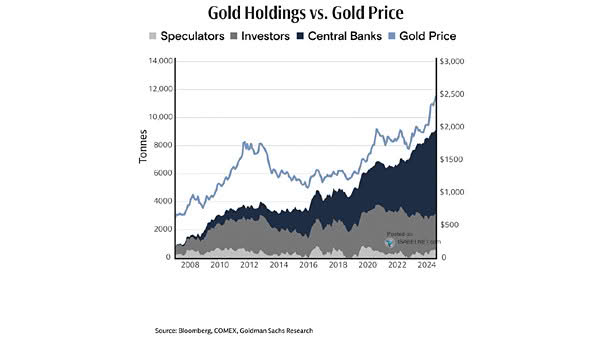
GLD Gold Holdings SPDR Gold Shares (GLD) is the world’s largest physical gold ETF. A continued growth in ETF gold holdings over a period of time could be a bullish factor. Image: State Street Global Advisors SPDR Gold Shares, Lighthouse

How Does A First Rate Cut Affect the Stock Market?

How Does A First Rate Cut Affect the Stock Market? Since 1970, the first rate cut has been bullish for the S&P 500 for the next 12 months, with recession and no recession. Image: Fidelity Management and Research

Equity Market Driven by Bonds Not Profits

Equity Market Driven by Bonds Not Profits The chart shows a widening gap between cyclicals and bond proxies. It is clearly a cyclical bear market within a bull market, as during the dotcom bubble. Image: Societe Generale Cross Asset Research

Don’t Fight the Tape or the Fed

Don’t Fight the Tape or the Fed When the Tape and Fed lean bullish, as today, the S&P 500 has historically risen at 17.96%/year since 1968 vs. 9.98%/year on a buy-and-hold basis. Image: Ned Davis Research

S&P 500 – Secular Roadmaps

S&P 500 – Secular Roadmaps The chart shows the S&P 500 projection based on average secular bull and the CAPE model. Image: Fidelity Investments

Weekly AAII Investor Sentiment Survey

Weekly AAII Investor Sentiment Survey Bulls push above bears, but when doubt and fear are still present, it does not usually look like a major market top. Image: Reuters

Equity Market Performance Around Bear Markets

Equity Market Performance Around Bear Markets Interesting chart showing the average return before and after equity market peaks from 1945 to 2018. You may also like “First, Middle, Final Years of S&P 500 Bull Markets since 1975.” Image: J.P. Morgan Asset Management

Dow Jones Transportation Average vs. S&P 500

Dow Jones Transportation Average vs. S&P 500 This interesting chart suggests that the Dow Jones Transportation Average underperforms in secular bull markets. Actually, the S&P 500 had higher returns when the Dow Jones Transportation Average experienced negative momentum. Image: Oppenheimer & Co.

Margin Debt and S&P 500

Margin Debt and S&P 500 This chart shows that margin debt has not recovered from last December’s lows, while the stock market has risen sharply.Usually, it is mostly bullish for stocks, because investors are still fearful. Image: Yardeni Research, Inc.