Buyback Contribution to EPS Growth
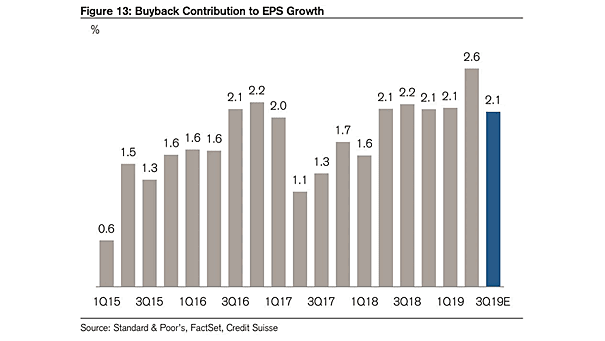
Buyback Contribution to EPS Growth Buybacks constitute a very important part of the earnings payout. Without them, there is no EPS growth. Image: Credit Suisse Research
Buyback Contribution to EPS Growth Buybacks constitute a very important part of the earnings payout. Without them, there is no EPS growth. Image: Credit Suisse Research
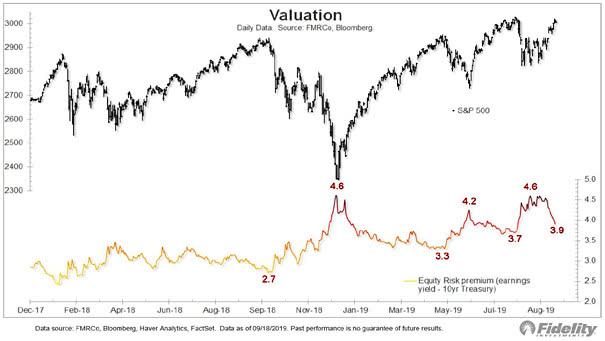
S&P 500 Valuation and Equity Risk Premium This chart shows that the equity risk premium (earnings yield less 10-year Treasury yield) has declined to 3.9%. Image: Fidelity Investments

Time Lags Between Indicators and Recessions Chart showing that credit standards, earnings and the yield curve are the earliest recession indicators. Image: Oxford Economics
Equity Risk Premium The equity risk premium (earnings yield less bond yield) stands at 4.48% (the 90th percentile since 1985). It suggests that equities are cheap relative to bonds. Image: Fidelity Investments
S&P 500 EPS vs. U.S. Nonfinancial Corporate Profits Creative accounting is imaginative ways to present accounts. The divergences between earnings and U.S. nonfinancial corporate profits occur before recessions. Image: Gavekal, Macrobond
Stock Plus Bond Market Capitalization as a Percentage of Nominal GDP The current reading is pretty high at 274.47%. You may also like the “Stock Market Valuation” and “S&P 500 Index – Earnings & Valuation.” Image: Bianco Research
Stock Market Capitalization as a Percentage of Nominal GDP This ratio is useful in determining whether the U.S. stock market is undervalued or overvalued relative to its historical average. The current reading is pretty high at 149.15%. You may also like the “Stock Market Valuation” and “S&P 500 Index – Earnings & Valuation.” Image: Bianco Research
South Korean Exports vs. S&P 500 EPS Estimates The correlation between South Korean exports and S&P 500 EPS estimates suggests a weakness in S&P 500 earnings estimates. Image: Lohman Econometrics
World Semiconductor Sales and S&P 500 EPS Tight relationship between world semiconductor sales and S&P 500 earnings per share. You may also like “Semiconductor Sales vs. Global Earnings per Share.” Image: Oxford Economics
EPS Growth This Cycle This chart shows the exceptional earnings growth in the technology sector over this business cycle. Image: KKR Global Macro