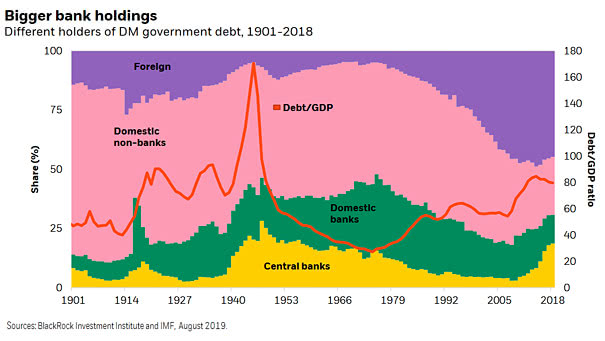
Different Holders of DM Government Debt

Different Holders of DM Government Debt The chart shows the historical breakdown of different holders of DM government bonds and overall DM debt-to-GDP. Even with QE, central bank government bond holdings are below historical peaks. Image: BlackRock Investment Institute
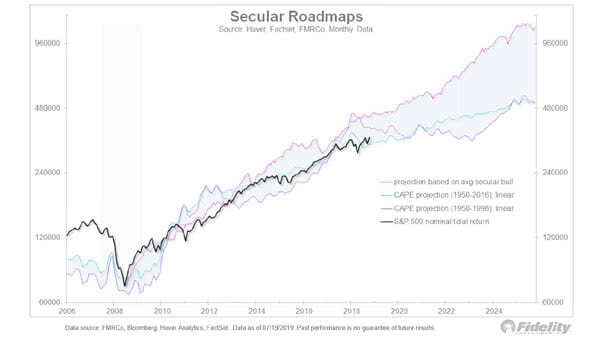
S&P 500 – Secular Roadmaps

S&P 500 – Secular Roadmaps The chart shows the S&P 500 projection based on average secular bull and the CAPE model. Image: Fidelity Investments

Real Total Return Performance of U.S. 60/40 Portfolio

Real Total Return Performance of U.S. 60/40 Portfolio The term “lost decade” for the traditional 60/40 portfolio holds historical significance, especially during the period from 2000 to 2009, when investors faced a real loss. Image: Goldman Sachs Global Investment Research

U.S. 10-Year Treasury Yields Forecast

U.S. 10-Year Treasury Yields Forecast Goldman Sachs has projected that the 10-year U.S. Treasury yield will reach 3.85% by the end of 2024, a forecast that stands in stark contrast to prevailing futures market expectations. Image: Goldman Sachs Global Investment Research

GS U.S. Financial Conditions Index

GS U.S. Financial Conditions Index Despite expectations of Federal Reserve easing, financial conditions have tightened in recent weeks. Image: Goldman Sachs Global Investment Research

Median 2-Week S&P 500 Returns

Median 2-Week S&P 500 Returns While seasonality can help assess stock market probabilities, it’s important to remember that past performance doesn’t guarantee future results. That said, November has historically been a strong month for U.S. stocks. Image: Goldman Sachs Global Investment Research

Global Fund Flows

Global Fund Flows Cash, equity, and bond funds globally are experiencing significant inflows, indicating a growing confidence in diversified asset allocation strategies. Image: Goldman Sachs Global Investment Research

Sentiment Indicator and Stock Positioning

Sentiment Indicator and Stock Positioning The fact that the Goldman Sachs sentiment indicator is not stretched at the moment is a positive sign, suggesting balanced investor sentiment, which is generally viewed as favorable for market stability. Image: Goldman Sachs Global Investment Research

Valuation – S&P 500 Median Fwd P/E

Valuation – Median Forward P/E While there are valid concerns about high valuations and market concentration, the present situation of the 10 largest U.S. stocks differs significantly from the dot-com bubble of the late 1990s. Image: Goldman Sachs Global Investment Research

Distribution of Forecast 10-Year Annualized S&P 500 Returns

Forecast 10-Year Annualized S&P 500 Returns Based on the 10-year annualized total return forecast distribution, there’s a 72% likelihood that the S&P 500 will underperform Treasury bonds, and a 33% probability that equities will generate returns below inflation. Image: Goldman Sachs Global Investment Research