U.S. ISM Services PMI
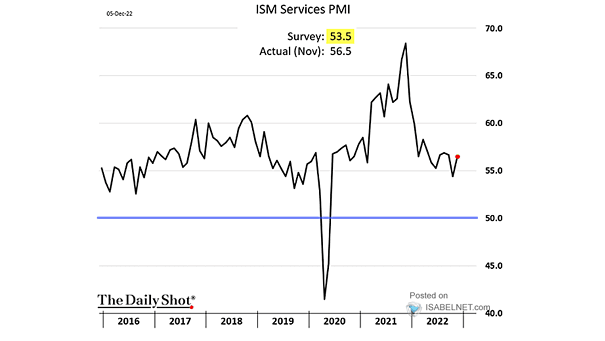
U.S. ISM Services PMI The U.S. ISM Services Index came in much higher than expected in November. Could the Fed be more hawkish? Image: The Daily Shot
U.S. ISM Services PMI The U.S. ISM Services Index came in much higher than expected in November. Could the Fed be more hawkish? Image: The Daily Shot
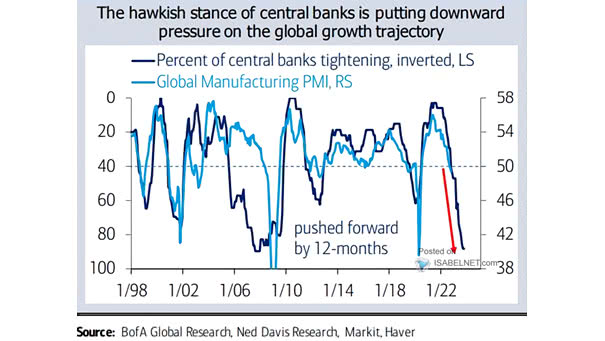
Percent of Central Banks Tightening vs. Global Manufacturing PMI Global policy tightening is putting downward pressure on global growth. Image: BofA Global Research

Earnings – Global Manufacturing PMI New Orders vs. World Trailing 12-Month EPS (Leading Indicator) Global manufacturing PMI new orders tend to lead world EPS growth by 12 months. Image: BofA Global Research
Manufacturing PMIs Manufacturing PMIs suggest that the industrial sector may continue to weaken ahead. Image: BofA Global Research
ISM Manufacturing PMI vs. Cyclicals/Defensives Ratio Could the ISM Manufacturing PMI fall into contraction territory? Image: The Daily Shot
ISM Manufacturing PMI Headline vs. ISM Manufacturing New Orders – Inventories The ISM New Orders less Inventories suggests a lower ISM Manufacturing PMI. Image: Morgan Stanley Research
S&P 500 and Manufacturing PMI Will PMIs continue to head lower and drive the S&P 500 down? Image: Morgan Stanley Research
U.S. ISM Manufacturing PMI vs. Growth Tax (Leading Indicator) Should investors expect a sharp contraction of the U.S. economy? Image: Alpine Macro
Inflation – U.S. Core CPI vs. ISM Manufacturing PMI (Leading Indicator) The U.S. ISM Manufacturing PMI tends to lead U.S. core CPI by 12 months. Image: BCA Research
S&P 500 Ratio to 200 DMA and ISM Manufacturing PMI The S&P 500 was pricing an ISM Manufacturing PMI of 40. Image: Deutsche Bank Asset Allocation
ISM Manufacturing PMI and Recession Probability Morgan Stanley’s recession indicator signals a 27% probability of a downturn in the next 12 months. Image: Morgan Stanley Wealth Management