Financial Stress and Conditions

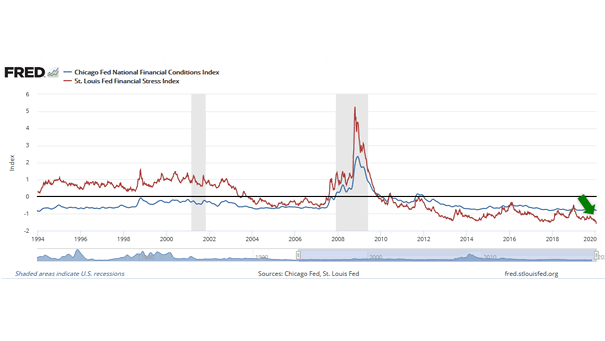
Financial Stress Index and Financial Conditions Index If financial conditions tighten sharply, this suggests a coming slowdown or recession. Currently, the St. Louis Financial Stress Index and the Chicago Fed National Financial Conditions Index are at lowest and below zero. The average value of the St. Louis Financial Stress Index is designed to be zero since…
St. Louis Fed Financial Stress Index

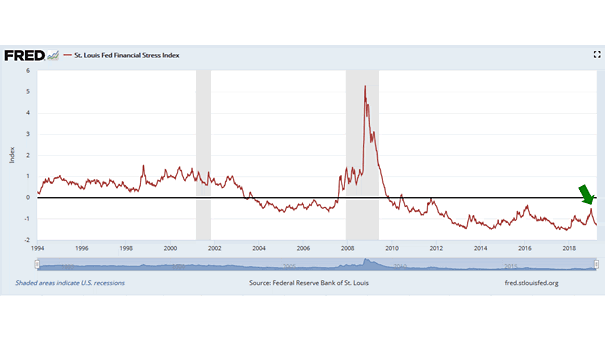
St. Louis Fed Financial Stress Index Before a coming recession, also watch the St. Louis Fed Financial Stress Index for forecasting the future. It uses 18 weekly data series to measure financial stress in the market: seven interest rate series, six yield spreads and five other indicators. Each of these variables captures some aspect of financial stress.…

U.S. ISM Manufacturing PMI vs. 10-Year U.S. Treasury Yield

U.S. ISM Manufacturing PMI vs. 10-Year U.S. Treasury Yield Easing rate pressure is projected to facilitate a recovery in U.S. manufacturing as financial conditions improve, inflation declines, and both domestic and foreign demand strengthen. Image: BofA US Equity & Quant Strategy

S&P 500 Annual Buybacks

S&P 500 Annual Buybacks Goldman Sachs predicts a substantial rise in S&P 500 share buybacks throughout 2024 and 2025. This growth is expected to be fueled by continued strong earnings from technology companies and improved financial conditions. Image: Goldman Sachs Global Investment Research

When Do You Expect the U.S. Equity Market Will Peak?

When Do You Expect the U.S. Equity Market Will Peak? 77% of financial advisors believe the bull market will continue beyond 2024, as they expect stellar corporate results, easy financial conditions, and lower interest rates to support its continuation. Image: BofA US Equity & Quant Strategy

S&P 500 vs. 1982 Analog

S&P 500 vs. 1982 Analog With financial conditions easing considerably and the Fed set to cut rates in 2024, will the S&P 500 continue to track the 1982 analog? Image: Fundstrat Global Advisors, LLC

U.S. TED Spread

U.S. TED Spread The TED spread (spread between 3-month LIBOR and 3-month Treasury bill) shows that financial conditions are tightening at the fastest pace since the 2008 crisis.

U.S. Stock Market Bull and Bear Indicator

U.S. Stock Market Bull and Bear Indicator Using multiple financial data, this great model helps investors navigate through different market conditions. It suggests whether the U.S. stock market tendency is bullish, bearish or neutral. It is a contrarian indicator. A bullish signal suggests that the U.S. stock market may go up, while a bearish signal…

S&P 500 and the 28-Week Williams %R

S&P 500 and the 28-Week Williams %R The Williams %R indicator is an effective tool for identifying overbought and oversold conditions in financial markets. A sustained overbought condition may indicate a healthy market. Image: BofA Global Research

U.S. Consumer Sentiment

U.S. Consumer Sentiment The University of Michigan Consumer Sentiment Index is more sensitive to financial markets, whereas the Conference Board Index reflects labor market conditions. Image: J.P. Morgan