Equity Fund Flows
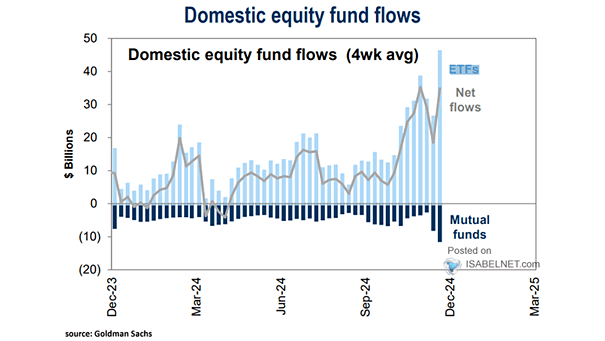
Equity Fund Flows Investors are showing growing optimism in U.S. stocks, leading to the largest monthly inflow in U.S. equity ETFs and mutual funds since 2022. Image: Goldman Sachs Global Investment Research
Equity Fund Flows Investors are showing growing optimism in U.S. stocks, leading to the largest monthly inflow in U.S. equity ETFs and mutual funds since 2022. Image: Goldman Sachs Global Investment Research
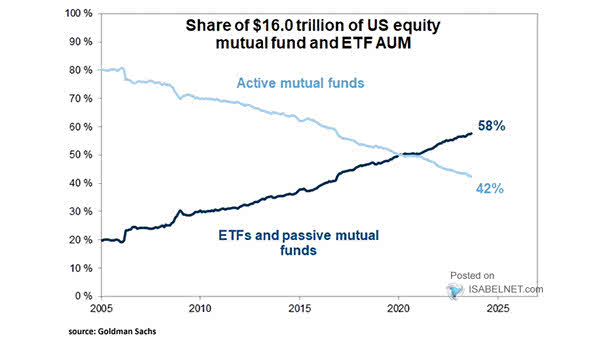
Share of U.S. Equity Mutual Fund and ETF AUM Passive U.S. equity funds surpassed active ones in 2020. Investors prefer them for their lower fees, potential tax benefits, and doubt in active fund managers’ ability to consistently outperform the market. Image: Goldman Sachs Global Investment Research

Flow of Funds Annual U.S. Treasury Purchases by Sector Money market mutual funds and the Fed will buy the vast majority of new Treasury supply in 2020. Image: Goldman Sachs Global Investment Research
Passive Equity and Bond Funds vs. Active Equity and Bond Funds The popularity of passive investing through ETFs and index mutual funds has grown significantly since 2010. Image: Financial Times
U.S. Active vs. Passive Fund Net Flows Active mutual funds exhibit persistent outflows, while inflows into index-tracking U.S. mutual funds and ETFs continue to rise. Image: Bloomberg
Passive vs. Active Rolling 6-Month Flows Flows into passive mutual funds and ETFs continue to surpass those into active funds. This trend is driven by factors such as lower costs, strong performance, and the rise of ETFs. Image: Goldman Sachs Global Investment Research
Annual U.S. Treasury Purchases by Sector This chart suggests that the Fed and money market mutual funds will buy the vast majority of new Treasury supply this year. Image: Financial Times
U.S. Corporate Bond Market Risk It is different this time. Since the 2008 regulations change, corporate bond market-risk-taking has moved from banks to investors in mutual funds. Image: Swedbank Research
The Rise of Passive Investing Net inflows into index-tracking U.S. mutual funds and ETFs rose by around 50% in the second quarter from a year earlier. Image: The Wall Street Journal
Who Owns the Equity Market? Most of the equity market is owned by households and mutual funds. But ETFs and foreigners continue to gain share. Image: Bianco Research