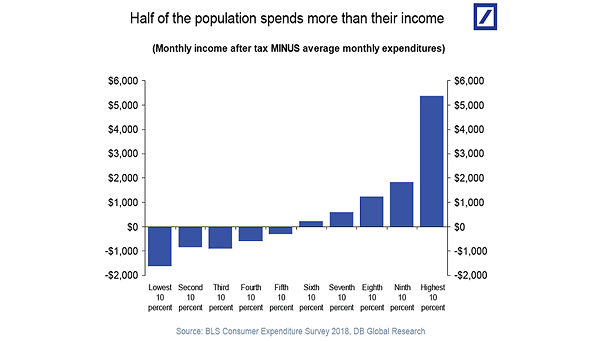
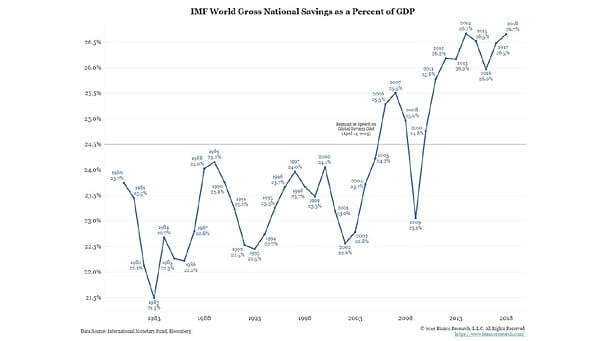
Demographics – IMF World Gross National Savings as a Percent of GDP
Demographics – IMF World Gross National Savings as a Percent of GDP Aging populations may well boost savings. This chart is a very good illustration. Image: Bianco Research
Demographics – Forecasting U.S. GDP This chart suggests that aging population is weighing down growth. Image: Arbor Research & Trading LLC
Demographics – Old Age Dependency Ratio The world’s population is ageing and demographics explain low interest rates. Image: Arbor Research & Trading LLC
Demographics – Older Societies Have Lower Inflation This interesting chart shows again that an aging population leads to lower inflation (R² = 0.45). Image: Oxford Economics
Cash Use vs. Internet Penetration Around the World Interesting correlation between the use of cash and the internet users as percentage of the population. Image: The Economist
Valuation and Demographics Our world is aging with high levels of debt and low interest rates, maybe for a long time. The chart shows that an aging population affects yields. You may also like “Debt and Demographics.” Image: Fidelity Investments
U.S. Labor Force vs. Inflation The chart shows the enduring link between labor force and inflation. The chart also suggests that U.S. labor force leads U.S. CPI by three years. Demographic trends imply subdued inflation. You may also like “World Population & Demographics – More People Over 65 than Under 5 for the First Time.”…
Demographics Explain Sovereign 30-Year Yields Accross Emerging Markets Another great chart showing that emerging market demographics explain 30-year sovereign bond yields. An R² of 0.80 is quite high and significant. You may also like “U.S. Population Growth vs. U.S. 10-Year Treasury Bond Yield.” Image: Arbor Research & Trading LLC
How Many People Are There in the World in 2019? The world population was estimated to have reached 7.7 billion people as of April 2019. Image: Visual Capitalist Click the Image to Enlarge
Why Potential GDP Has Been Cut in Half Since the 1950’s? The main reason is a lower productivity than previous business cycles, due to: – lower population growth – the service sector is growing faster than the industry sector – lower quality jobs in the service sector have a lower productivity than in the industrial…