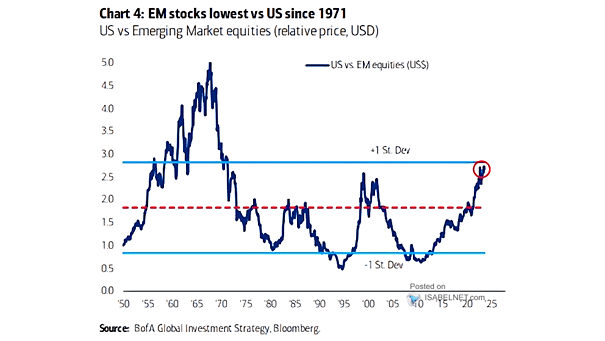
U.S. 10-Year Treasury Yield – Monthly Chart

U.S. 10-Year Treasury Yield – Monthly Chart The gradual approach of the U.S. 10-year Treasury yield towards the secular target carries significant implications for various sectors of the economy and financial markets. Image: BofA Global Research

Commodities – Commodity Prices

Commodities – Commodity Prices Is the spike in commodity prices a long-term secular bull market? Image: Alpine Macro

Stocks – World Value vs. Growth

Stocks – World Value vs. Growth Growth has outperformed Value since the GFC. Does the secular trend still favor Growth? Image: Goldman Sachs Global Investment Research

Inflation – S&P 500 and the CPI YoY Index

Inflation – S&P 500 and the CPI YoY Index The secular chart could suggest a late 1950s pattern. Rising inflation is not necessarily bearish for the S&P 500. Image: BofA Global Research Click the Image to Enlarge

S&P 500 Total Return – The Market Cycle

S&P 500 Total Return – The Market Cycle Since the March low, the U.S. stock market continues to behave like a secular bull market. Image: Fidelity Investments