Citi Economic Surprise Index vs. EUR/USD
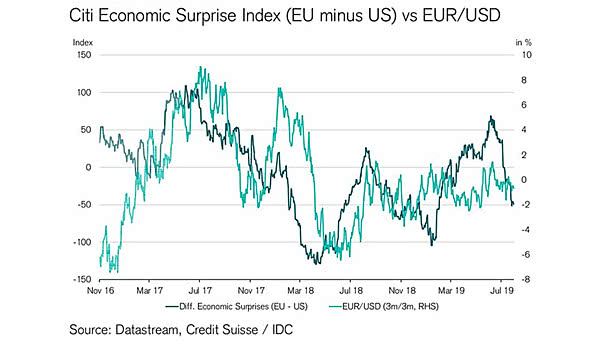
Citi Economic Surprise Index vs. EUR/USD Weaker European growth relative to the U.S. could weaken Euro/U.S. Dollar. Image: Credit Suisse
Citi Economic Surprise Index vs. EUR/USD Weaker European growth relative to the U.S. could weaken Euro/U.S. Dollar. Image: Credit Suisse
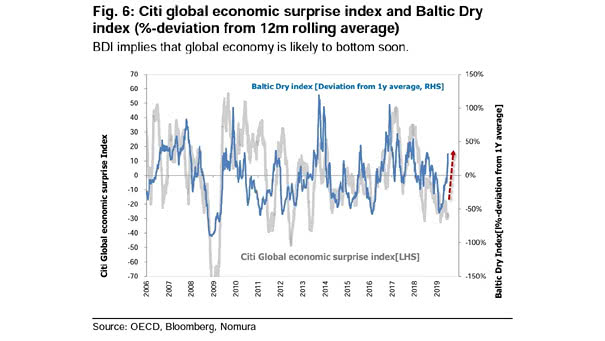
Citi Global Economic Surprise Index and Baltic Dry Index The divergence between the Baltic Dry Index and the Citi Global Economic Surprise Index could suggest that “global economy is likely to bottom soon.” Image: Nomura

S&P 500 and U.S. Economic Surprises This chart shows the current divergence between the S&P 500 YoY and the 12-month moving average of the U.S. economic surprise index. Image: Oxford Economics and Macrobond
S&P 500 vs. U.S. Economic Surprises This chart shows the large divergence between the S&P 500 Total Return and the U.S. economic surprise. You may also like “S&P 500 at Risk of a 10% Correction.” Image: Nordea and Macrobond
Citigroup Economic Surprise Index vs. 10-Year Treasury Yield This chart shows a good correlation between Citigroup Economic Surprise Index and 10-year Treasury yield. Lower yields ahead? You may also like “For the Last Few Years, Equity Markets Have Been Leading Bond Markets.” Image: Yardeni Research, Inc.
Federal Funds Rate By aligning market expectations with its policy intentions, the Fed minimizes surprises in the fed funds rate relative to market pricing at the start of the blackout period, thereby reducing the likelihood of market disruptions. Image: Deutsche Bank
Difference Between Initial Release and Consensus Expectations of U.S. GDP U.S. GDP was one of the biggest upside surprise compared to consensus expectations, highlighting the challenges of accurately forecasting economic trends and outcomes. Image: BofA Global Research
Inflation – U.S. CPI vs. Median Forecast Will U.S. headline CPI continue to surprise to the upside? Image: BofA Global Research
Was the US Stock Market Crash on October 19, 1987, a “Black Swan” Event? A “Black Swan” is a metaphor that describes an event that comes as a surprise with a major effect, which is extremely difficult to predict. The theory was developed by Nassim Nicholas Taleb. The US stock market on October 19, 1987,…