Dollar Index vs. MSCI Emerging Markets Relative Performance

Dollar Index vs. MSCI Emerging Markets Relative Performance Interesting chart showing the correlation of -0.89. Emerging markets could soar if the U.S. dollar falls. You may also like “Twin Deficits (% of GDP) Lead Real Trade Weighted Dollar Index by Two Years.” Image: Paolo Cardena

Industrial Search Trends Looking Optimistic

Industrial Search Trends Looking Optimistic This chart shows the rise in search interest in the U.S.. That’s good news after a fall in 2018, because industrial search trends tend to lead realized growth by a decent margin. Image: Arbor Research & Trading LLC

Fed Funds Rate vs. S&P 500

Fed Funds Rate vs. S&P 500 This chart suggests that the Fed funds rate leads the S&P 500 by 1 to 3 years since the 1990s. Image: Wells Fargo Investment Institute

Citigroup Economic Surprise Index vs. 10-Year Treasury Yield

Citigroup Economic Surprise Index vs. 10-Year Treasury Yield This chart shows a good correlation between Citigroup Economic Surprise Index and 10-year Treasury yield. Lower yields ahead? You may also like “For the Last Few Years, Equity Markets Have Been Leading Bond Markets.” Image: Yardeni Research, Inc.

Global PMI & US ISM Manufacturing Indices

Global PMI & US ISM Manufacturing Indices This chart suggests that Global PMI Manufacturing Index leads US ISM Manufacturing Index by two months. Image: Capital Economics

MSCI Emerging Markets Index vs. World Semiconductor Sales

MSCI Emerging Markets Index vs. World Semiconductor Sales This great chart suggests that world semiconductor sales lead the MSCI emerging markets index by 3 months. Very interesting chart before investing in emerging market equities. Country weights of the MSCI Emerging Markets Index: 33% China, 13.02% Korea, 11.35% Taiwan. Image: Nordea and Macrobond

Second-half Recovery in Growth?

Second-half Recovery in Growth? Better economic data could extend the business cycle. Currently, G7 & BRIC leading indicators remain encouraging and suggest no imminent recession. Image: Richardson Wealth

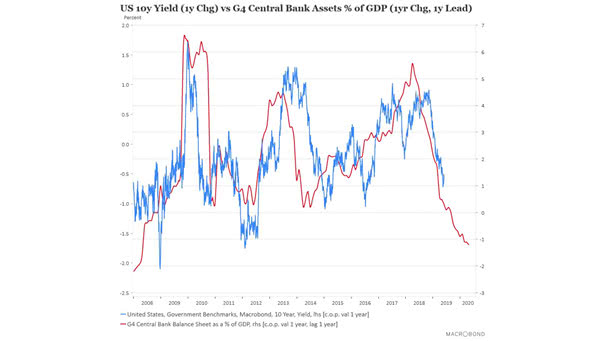
Can The U.S. 10-Year Treasury Yield Fall Further?

Can The U.S. 10-Year Treasury Yield Fall Further? Well, according to this chart, the U.S. 10-year treasury yield could fall further. The chart suggests that G4 central bank assets as percentage of GDP (1-year change) lead U.S. 10-year Treasury yield (1-year change) by one year. Image: Macrobond