U.S. Federal Debt
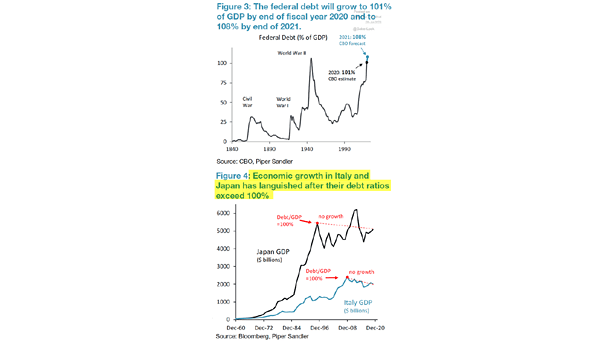
U.S. Federal Debt A potential warning sign for the U.S. economy, as economic growth in Japan and Italy came to a halt after their debt-to-GDP ratios exceeded 100%. Image: Piper Sandler
U.S. Federal Debt A potential warning sign for the U.S. economy, as economic growth in Japan and Italy came to a halt after their debt-to-GDP ratios exceeded 100%. Image: Piper Sandler
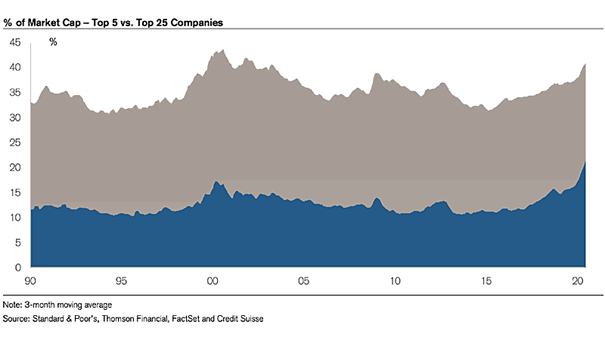
% of Market Capitalization – Top 5 vs. Top 25 Companies This charts highlights the high concentration of market capitalization in the 5 and 25 largest S&P 500 companies over time. Image: Credit Suisse Research

Market Capitalization of the Largest 10 Companies as a % of the Index Market Capitalization This charts highlights the high concentration of market capitalization in the largest 10 companies. Image: Goldman Sachs Global Investment Research
World GDP – OECD Global Economic Outlook According to the OECD, the coronavirus crisis means no V-shaped recovery, as the consequences will be severe and long-lasting. Image: Organisation for Economic Co-operation & Development
Top 5 Largest Constituents as Percent of Market Capitalization This charts highlights the extreme concentration of market cap in the U.S. and global emerging markets in the top five stocks. Image: Credit Suisse Research
Bear Market – Comparing Speed of Decline to Speed of Recovery Of the 10 stock market drawdowns of about 30% since 1920, the median time needed to recover half of losses, was half the duration of the decline. Image: CNBC
U.S. High-Yield vs. Investment-Grade and MSCI ACWI ex-US (Leading Indicator) This chart suggests that the ratio of high-yield to investment-grade bond performance is a leading indicator for stocks. Image: BofA Global Investment Strategy
U.S. Stock Market – 9/11 as Analog to Coronavirus This chart compares 9/11 to coronavirus. It shows the P/E ratio as a percentile, and EPS. Image: Fidelity Investments
Average S&P 500 1-Year Performance Based on Valuation Starting Point The S&P 500 P/E ratio is over 18x currently. As valuations rise, expected returns fall. Image: Richardson Wealth
Fed’s Balance Sheet Composition Chart suggesting that the Fed should buy more Treasury bills and shift away from repo operations over time. Image: Deutsche Bank
China’s Monetary Policy The Chinese banks’ reserve requirement ratio will be cut by 50 bps on January 6, to 12.5%. Image: Bianco Research