China’s Monetary Policy
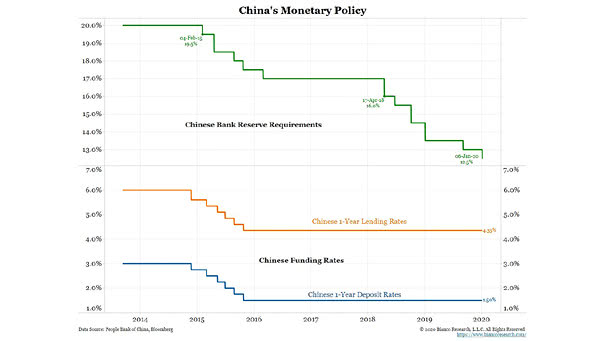
China’s Monetary Policy The Chinese banks’ reserve requirement ratio will be cut by 50 bps on January 6, to 12.5%. Image: Bianco Research
China’s Monetary Policy The Chinese banks’ reserve requirement ratio will be cut by 50 bps on January 6, to 12.5%. Image: Bianco Research
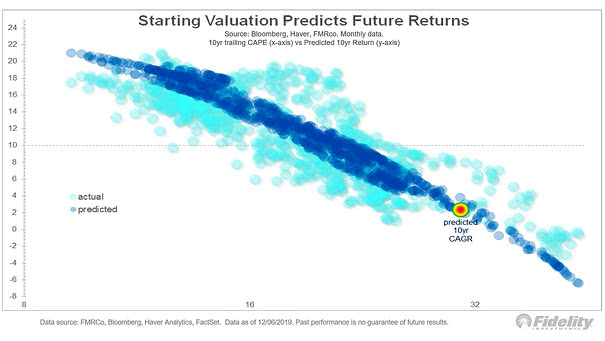
Starting Valuation Predicts Future Returns Based on the Shiller CAPE ratio, the chart suggests a 10-year compound annual growth rate of only 2% to 4% for the U.S. stock market. Image: Fidelity Investments

Gross Margin: S&P 500 Large Cap vs. S&P 600 Small Cap and S&P 400 Mid Cap Gross margins between large and small caps are widening. Industries with highest concentrations are getting all of the gross margin improvement. Image: Arbor Research & Trading LLC
Global Growth and U.S. vs. Emerging Markets Differential The U.S. has led in several periods of global growth acceleration since 2010. Image: Goldman Sachs Global Investment Research
U.S. Cyclicals vs. Defensives It’s all about sector rotation: the cyclicals vs. defensives trade is now pricing a growth acceleration. Image: Goldman Sachs Global Investment Research
Profit Margins of S&P Large Caps and Small Caps Profit margins between small and large caps are widening. Industries with highest concentrations are getting all of the profit margin improvement. Image: Arbor Research & Trading LLC
Where Do State Tax Revenues Come From? The most important category of revenue is individual income, followed by general sales. Income taxes paid by corporations rank fourth. Image: howmuch.net
Stall Probability by Scenario for U.S. Payroll Employment Chart suggesting that stall risks rise considerably and could intensify with greater deceleration in payroll employment in 2020. Image: Barclays Research
U.S. Population Growth U.S. population growth is slowing to its lowest rate, due to in large part to aging population. Improvements to immigration policies would greatly help the U.S. economy. Image: TD Bank Financial Group
MSCI World Index Valuation at Cycle Peaks and Troughs On average, the MSCI World Index currently trades at a price-to-earnings ratio that has marked cyclical peaks in the stock market over the past 50 years. Image: Charles Schwab