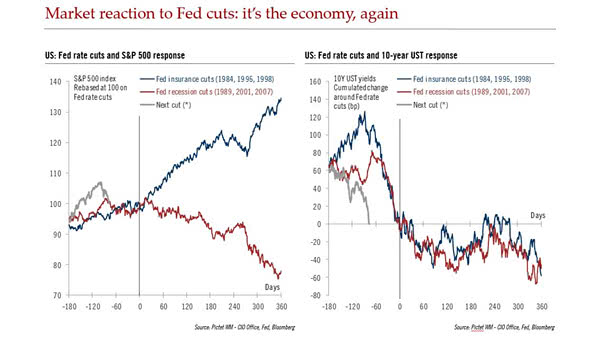
MSCI Eurozone vs. MSCI U.S.

MSCI Eurozone vs. MSCI U.S. This chart shows the large divergence between the MSCI Eurozone Index and the MSCI U.S. Index. Is this an opportunity to increase exposure to eurozone equities? Image: Financial Times

U.S. Long-Term Business Cycle and Recessions

U.S. Long-Term Business Cycle and Recessions This chart suggests that historically, when the U.S. long-term business cycle peaks in the 90th percentile and turns lower, it doesn’t bode well for equities around 4 months later on average. Image: Pictet Asset Management

Global Equity – Global Bond Fund Flows

Global Equity – Global Bond Fund Flows In the past two weeks, investors have shifted from bonds to equities. Image: BofA Merrill Lynch Global Investment Strategy

Dividend Yield of S&P 500 Components

Dividend Yield of S&P 500 Components Yields on equities seem competitive vs. U.S. Treasuries, but equity risk does not disappear because a company pays a dividend. Image: Bespoke Investment Group

S&P 500 Dividend Yield and 30-Year Treasury Bond

S&P 500 Dividend Yield and 30-Year Treasury Bond Are U.S. equities a “buy”? The dividend yield of the S&P 500 Index is now higher than the yield from a 30-year Treasury bond. This is a rare phenomenon. But the equity risk does not disappear because a company pays a dividend. Image: Bloomberg

S&P 500 Bull Market

S&P 500 Bull Market This is the longest equities bull market without a 20% drawdown. Image: Goldman Sachs

Equity Risk Premium

Equity Risk Premium The equity risk premium (earnings yield less bond yield) stands at 4.48% (the 90th percentile since 1985). It suggests that equities are cheap relative to bonds. Image: Fidelity Investments