Demographics – IMF World Gross National Savings as a Percent of GDP
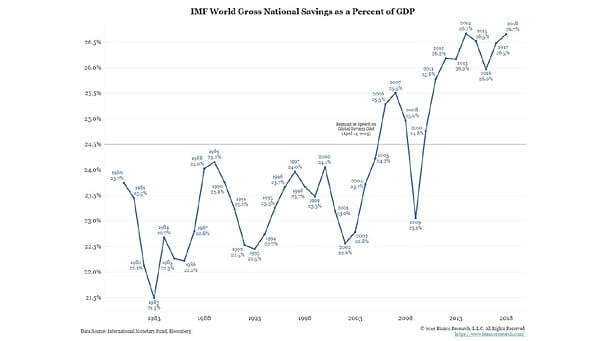
Demographics – IMF World Gross National Savings as a Percent of GDP Aging populations may well boost savings. This chart is a very good illustration. Image: Bianco Research
Demographics – IMF World Gross National Savings as a Percent of GDP Aging populations may well boost savings. This chart is a very good illustration. Image: Bianco Research
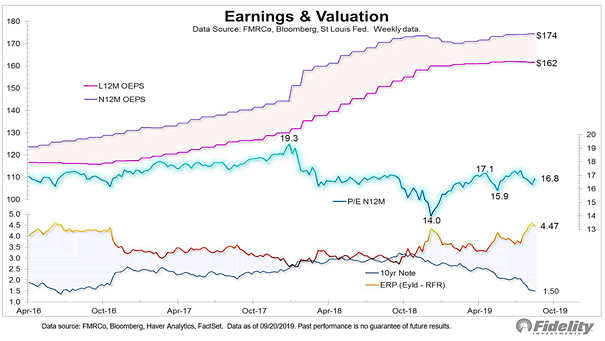
U.S. Market – Earnings, Valuation and Equity Risk Premium This chart shows that the P/E ratio is above average, but the equity risk premium is relatively high. Image: Fidelity Investments

Small Caps Debt-to-Equity Exceeds Large Caps The debt-to-equity ratio of small caps exceeds large caps for the first time. Image: Arbor Research & Trading LLC
Hedge Fund Portfolio Density and Turnover Hedge fund portfolio density has steadly increased, and fund turnover has declined over the past decade. High concentration risk can lead to high losses and affect the financial system. Image: Goldman Sachs
U.S. Excess Liquidity Growth Leads S&P 500 Returns This chart suggests that M2 money supply to nominal GDP ratio leads S&P 500 returns by one year. Is the S&P 500 vulnerable to a drop, followed by a recovery? Image: Oxford Economics, Macrobond
U.S. Initial Unemployment Claims and U.S. GDP There is a pretty good correlation between U.S. initial unemployment claims and U.S. GDP. Initial unemployment claims could suggest an acceleration of U.S. GDP in Q3 2019. Click on the Image to Enlarge
Stock Market Capitalization as a Percentage of Nominal GDP This ratio is useful in determining whether the U.S. stock market is undervalued or overvalued relative to its historical average. The current reading is pretty high at 149.15%. You may also like the “Stock Market Valuation” and “S&P 500 Index – Earnings & Valuation.” Image: Bianco Research
Are Small Cap Stocks Overvalued? Small Cap Stocks Valuation: based on the forward PE ratio, the valuation of small cap stocks seems reasonable, with no sign of bubble. You may also like our “Stock Market Valuation.” Image: Bianco Research
Is The U.S. Stock Market Overvalued? S&P 500 Valuation: the chart shows that the U.S. stock market is not cheap. Based on the forward P/E ratio, the S&P 500 is not extremely overvalued either. You may also like our “Stock Market Valuation.” Image: Bianco Research
Small Business Optimism Roars Back, Rivaling Historic Highs Small Business Optimism Index improved: expectations for sales, business conditions, and expansion rose. That’s good news for the U.S. economy. See why the “Small Businesses Optimism Index” is a good recession indicator. Image: National Federation of Independent Business (NFIB)
New York Fed Probability of Recession in Next 12 Months since 1990 When an inverted yield curve occurs, short-term interest rates exceed long-term rates. It suggests that the long-term economic outlookis poor and that the yields offered by long-term fixed income securities will continue to decline. Since 1962, no recession has occurred without an inverted…