S&P 500 PE Level vs. Average 12-month Return

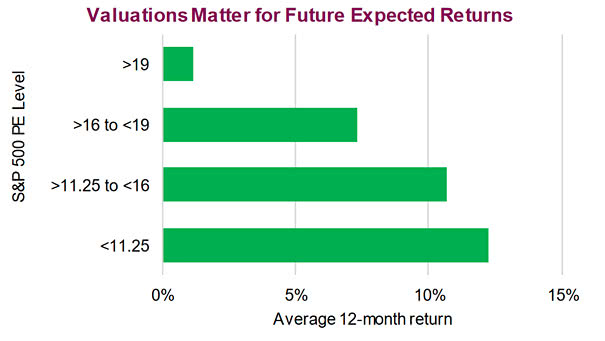
S&P 500 PE Level vs. Average 12-month Return The chart shows how market valuation affects future equity returns since 1930. You may also like “Why the Stock Market Valuation Matters Before a Recession?“ Image: Richardson Wealth
U.S. Debt Ratios to GDP (Household, Corporate, Government)

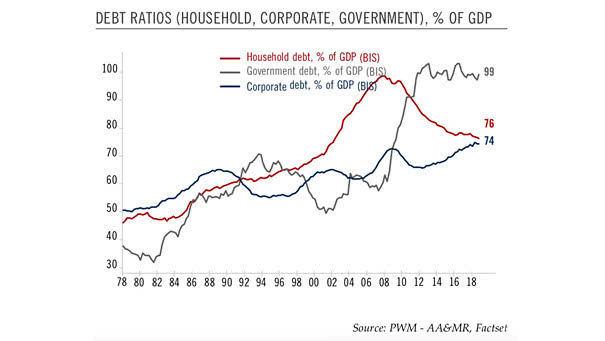
U.S. Debt Ratios to GDP (Household, Corporate, Government) U.S. households remain far less in debt than during the Great Recession, but U.S. corporate debt continues to rise rapidly and has exceeded record levels . Image: Pictet Wealth Management

Gold Bullion and Market Capitalization of Global Negative Yielding Debt

Gold Bullion and Market Capitalization of Global Negative Yielding Debt This chart shows a strong correlation between gold and market capitalization of global negative yielding debt. Keep in mind that negative global yields are a support for gold. Image: Pictet Wealth Management

Performance of Hedge Fund Index vs. S&P 500

Performance of Hedge Fund Index vs. S&P 500 Hedge fund returns have not been as good as those of the S&P 500, but volatility has been lower. Image: Richardson Wealth

10-Year Bund Yield and Manufacturing PMI

10-Year German Bund Yield and German Manufacturing PMI The 10-year German Bund yield could go positive again as recession fears dissipate. Image: Pictet Wealth Management

Second-half Recovery in Growth?

Second-half Recovery in Growth? Better economic data could extend the business cycle. Currently, G7 & BRIC leading indicators remain encouraging and suggest no imminent recession. Image: Richardson Wealth

Brent Price vs. 10-Year Treasury Bond Yield vs. S&P 500

Brent Price vs. 10-Year Treasury Bond Yield vs. S&P 500 This chart shows that oil prices are a good indicator of global economic growth and investors are concerned about a global economic slowdown. Image: Pictet Wealth Management

Market Reaction to Fed Insurance Cuts vs. Fed Recession Cuts

Market Reaction to Fed Insurance Cuts vs. Fed Recession Cuts This chart shows the S&P 500 and 10-year Treasury Note response to Fed insurance cuts vs. Fed recession cuts. There is a big difference for equities, but not too much for bonds. Image: Pictet Wealth Management

Distribution of Forward Returns by 200MA Slope

Distribution of Forward Returns by 200MA Slope This great chart shows the distribution of forward returns when the slope of S&P 500’s 200-day moving average is lower, flat or higher. Image: Ritholtz Wealth Management