Wage Growth, Monetary Policy and S&P 500
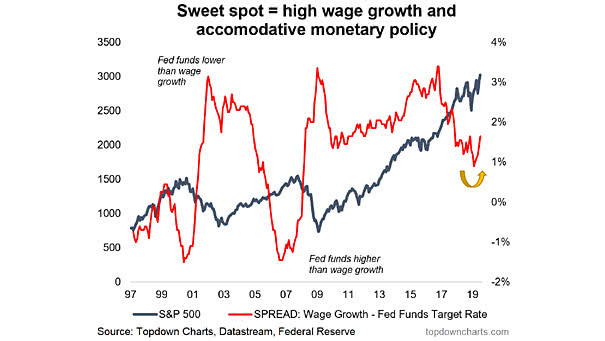
Wage Growth, Monetary Policy and S&P 500 When the spread between wage growth and the Fed funds rate is wide, it is generally positive for equities. Image: Topdown Charts
Wage Growth, Monetary Policy and S&P 500 When the spread between wage growth and the Fed funds rate is wide, it is generally positive for equities. Image: Topdown Charts
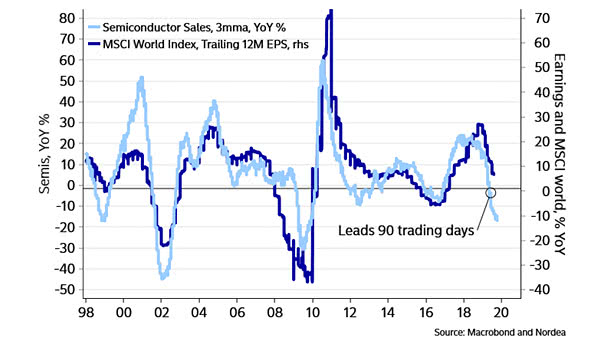
World Semiconductor Sales Lead Emerging Markets This chart suggests that world semiconductor sales lead the MSCI emerging markets index by 3 months. This is very interesting before investing in emerging market equities. Country weights of the MSCI Emerging Markets Index: 33% China, 13.02% Korea, 11.35% Taiwan. Image: Nordea and Macrobond

First Fed Rate Cut History tells us that a first 25-bps rate cut is bullish, while a first 50-bps rate cut is bearish. You may also like “U.S. Equities – One Year Return After a Fed Rate Cut.” Image: Ari Wald
S&P 500 and Hedge Fund Exposure While the S&P 500 is at all-time high, hedge funds increase their exposure to equities (last = 0.52). Image: Sentimentrader
Earnings Matter, Over the Long Run Over the long run, equities move with earnings. Currently, there is a big gap between U.S. and Europe earnings. As Warren Buffett said: “for 240 years, it’s been a terrible mistake to bet against America.” You may also like “Global Earnings since 2006.” Image: Cullen Roche
S&P 500 Performance Before and After Recessions since 1970 U.S. equities peaked about six months before the recession began. Image: Russell Investments
U.S. Equity Market Performance since 1914 Excellent comparison between real (adjusted for inflation) and nominal returns on U.S. equities. Image: Saxo Bank
Equity Fund Outflows at Record History tell us that equities rose significantly. Image: SunTrust IAG
Market Share of Algorithmic Trading by Asset Class Algorithmic trading has grown across asset classes, particularly in equities. Image: Goldman Sachs Global Investment Research
MSCI Emerging Markets Index vs. World Semiconductor Sales This great chart suggests that world semiconductor sales lead the MSCI emerging markets index by 3 months. Very interesting chart before investing in emerging market equities. Country weights of the MSCI Emerging Markets Index: 33% China, 13.02% Korea, 11.35% Taiwan. Image: Nordea and Macrobond