Central Bank Outlook
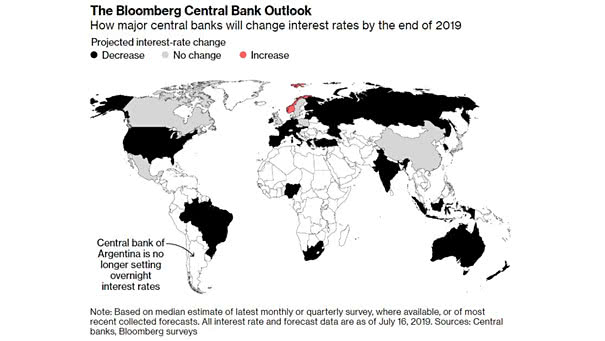
Central Bank Outlook Interesting chart showing how major central banks will change interest rates by the end of this year (projected interest-rate change). Picture Source: Bloomberg
Central Bank Outlook Interesting chart showing how major central banks will change interest rates by the end of this year (projected interest-rate change). Picture Source: Bloomberg
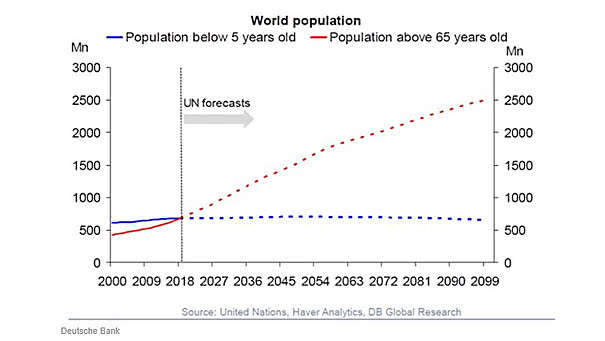
World Population & Demographics – More People Over 65 than Under 5 for the First Time This chart suggests that declining fertility rates lead to an aging population and secular stagnation. Image: Deutsche Bank Global Research

The Market Consistently Underestimates the Fed Usually, the Fed decides when to raise rates and the market decides when to cut rates. But, this interesting chart shows that the market consistently underestimates the Fed. You may also like “The Market is Almost Wrong about What the Fed Will Do.” Image: Real Investment Advice
Global Earnings since 2006 This chart shows global earnings since 2006 (USA, Emerging Markets, Japan and Europe). As Warren Buffett said: “for 240 years, it’s been a terrible mistake to bet against America.” This chart below illustrates it well since 2006. You may also like “Earnings Matter, Over the Long Run.” Source: J.P. Morgan Asset Management
U.S. 10-Year Treasury Bond Yield vs. U.S. Nominal GDP The U.S. 10-year Treasury bond yield is highly correlated with the U.S. nominal GDP growth (correlation = 77%). Image: KKR Global Macro
Debt and Demographics Our world is aging with high levels of debt and low interest rates (maybe for a long time). Image: Fidelity Investments
Increased Number of Zombie Companies Artificially low interest rates and investor demand for leveraged loans have created zombie firms. Image: Jupiter Asset Management
New York Fed Probability of Recession in Next 12 Months since 1990 When an inverted yield curve occurs, short-term interest rates exceed long-term rates. It suggests that the long-term economic outlookis poor and that the yields offered by long-term fixed income securities will continue to decline. Since 1962, no recession has occurred without an inverted…
Yield Curve Inversion, How Long Until The Recession? In recent history, once the 10-Year minus 3-Month Treasury yield spread is negative and hits 10 consecutive days, it persists for weeks/months. When an inverted yield curve occurs, short-term interest rates exceed long-term rates. It suggests that the long-term economic outlook is poor and that the yields offered…
The Market is Almost Wrong about What the Fed Will Do Actually, the Fed decides when to raise rates. But the market decides when to cut rates: “Markets have accurately priced in cuts before easing cycles begin.” Keep in mind that rate cut expectations are highly predictive six months in advance. You may also like “Fed Policy…