Valuation Metrics Across Assets
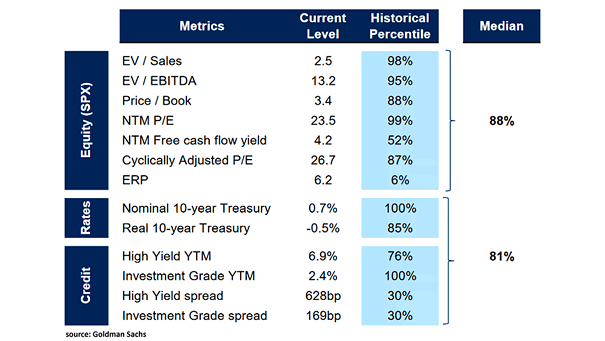
Valuation Metrics Across Assets This table suggests that median valuation metrics remain elevated by historical standards. Image: Goldman Sachs Global Investment Research
Valuation Metrics Across Assets This table suggests that median valuation metrics remain elevated by historical standards. Image: Goldman Sachs Global Investment Research
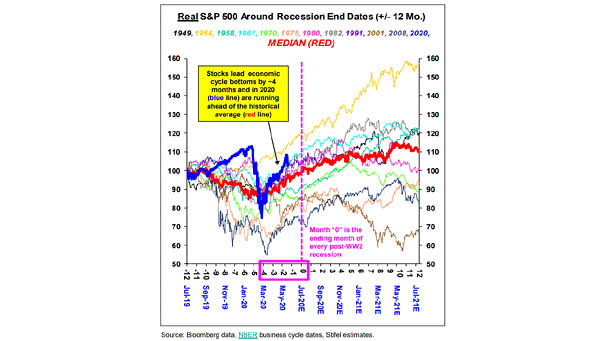
Real S&P 500 Around Recession End Dates This chart suggests that the S&P 500 is currently running ahead of the historical average. Image: Stifel

S&P 500 and >11% Above 50-Day Moving Average Short-term overbought, but historically, >11% above 50-day moving average has been bullish. Image: LPL Research
S&P 500 Return and U.S. Aggregate Bond Fund minus Fed Holdings Historically, U.S. equities tend to deliver positive returns when fixed income assets contract. Image: Arbor Research & Trading LLC
S&P 500 and Largest 50-Day Gains Ever (Greater than 20%) This was the greatest 50-day rally ever for the S&P 500. Historically, past big rallies saw the S&P 500 higher 6- and 12-months later. Image: LPL Research
Housing – U.S. Median Famility Income to Mortgage Cost This chart suggests that relative to family incomes, buying a home in the U.S. is currently quite affordable by historical standards. Image: Gavekal, Macrobond
Money Supply to GDP vs. Equities and Bonds Historically, when money supply exceeds nominal GDP growth, it tends to be bullish for stocks and bonds. Image: Gavekal, Macrobond
More than 90% of Stocks above 50-Day Moving Average Short-term overbought, but historically, more than 90% of stocks above the 50-day moving average is bullish. Image: Strategas Research Partners
Long/Short Hedge Funds Beta to Mega Cap Growth Stocks Hedge funds aren’t chasing the current market rally, as long/short hedge funds beta to the mega growth stocks is below historical average. Image: Deutsche Bank Asset Allocation
Purchasing Power of $100: S&P 500, Gold and Fiat Money Chart showing the purchasing power of $100 worth of fiat currency, gold and the S&P 500. Historically, stocks have won over the very long-term. Image: Fidelity Investments