S&P 500 with NYSE 90% Up Days
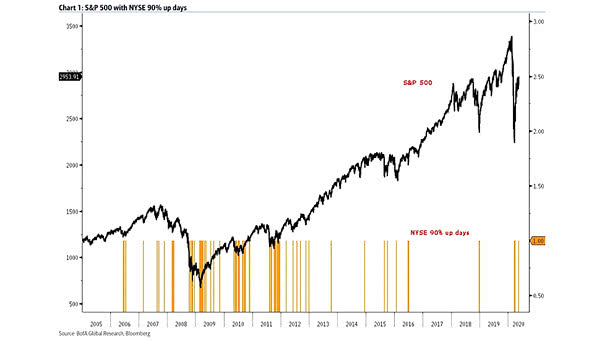
S&P 500 with NYSE 90% Up Days Historically, S&P 500 returns after an NYSE 90% up day are positive 80% of the time after 20 days. Image: BofA Global Research
S&P 500 with NYSE 90% Up Days Historically, S&P 500 returns after an NYSE 90% up day are positive 80% of the time after 20 days. Image: BofA Global Research
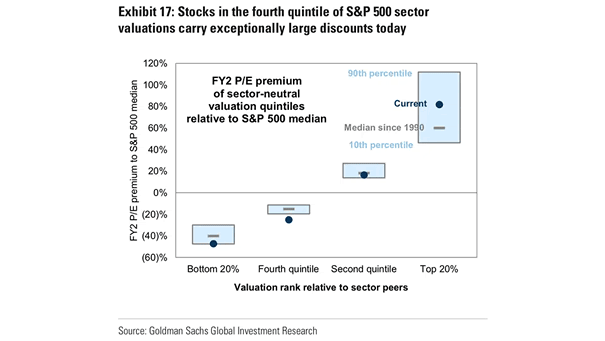
FY2 P/E Premium of Sector-Neutral Valuation Quintiles Relative to S&P 500 Median This chart shows S&P 500 sector valuations compared with their historical distribution since 1990. Image: Goldman Sachs Global Investment Research

Average Performance by S&P 500 Quality Ranks when the Profits Cycle Decelerated Historically, high quality stocks (A+) have outperformed when the profits cycle decelerates, as investors tend to pay up for stable earnings growth. Image: BofA US Equity and Quant Strategy
S&P 500 Index and Total Return to Gold Ratio According to BofA, the gold to equity ratio is elevated given the earnings uncertainty, but it is far from historical highs. Image: BofA Global Research
Earnings Declines During Recessions Historically, earnings tend to decline by a median of 18% during an U.S. recession. Image: LPL Research
ISM PMI and S&P 500 Monthly Return Historically, the best returns for the S&P 500 have been seen when ISM is low and rising. Image: Credit Suisse Research
ISM PMI Since 1950 and S&P 500 Forward Performance Historically, the S&P 500 forward performance is better when the ISM PMI is below 43. Image: Fundstrat Global Advisors, LLC
S&P 500 and 10% Monthly Gains, What Happens Next? Historically, 10% monthly gains for the S&P 500 have led to continued strong returns. Image: LPL Research
S&P 500 & E-mini – Small Traders Small trader positioning is still bearish, which is historically bullish for the S&P 500. Image: Renaissance Macro Research
S&P 500 and Best 15-Day Returns Ever Historically, the best 15-day returns ever have lead to strong returns over the next 12 months, with an average gain of 21.9%. Image: LPL Research