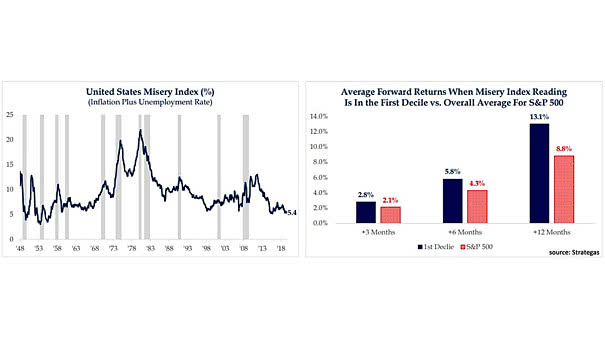
U.S. Misery Index and Average Forward Returns
U.S. Misery Index and Average Forward Returns The U.S. misery index (core inflation + unemployment) is approaching all-time low, because both inflation and unemployment are very low. Historically, average forward returns have been higher than the overall S&P 500 average.