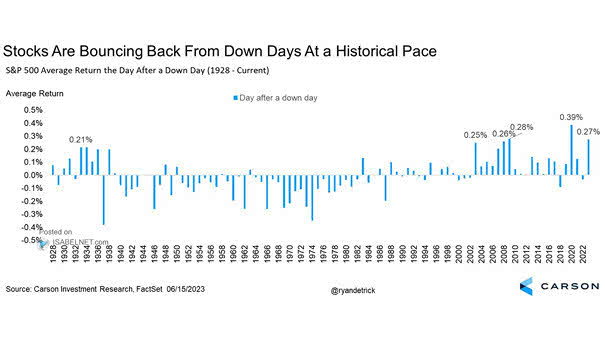
S&P 500 Average Return the Day After a Down Day

S&P 500 Average Return the Day After a Down Day This year, the S&P 500 has gained 0.27% on average following a down day. Will U.S. stocks make a new all-time high before the end of the year? Image: Carson Investment Research

Mega-Cap Growth Stocks vs. S&P 500

Mega-Cap Growth Stocks vs. S&P 500 Will artificial intelligence propel mega-cap growth stocks to all-time highs? Image: Deutsche Bank

S&P 500 Index – Bull vs. Bear Market

S&P 500 Index – Bull vs. Bear Market Will the S&P 500 return to its all-time high as it remains in a long-term trending bull market? Image: Real Investment Advice

S&P 500 – Number of Closing Highs

S&P 500 – Number of Closing Highs Will the S&P 500 break the all-time record of 77 new highs this year? Image: S&P 500 Dow Jones Indices

S&P 500 Future Returns After 7 New Highs in a Row

S&P 500 Future Returns After 7 New Highs in a Row Historically, after seven consecutive new all-time highs, it tends to be bullish for the S&P 500 Index over the next 12 months. Image: LPL Research

Equal-Weighted S&P 500 and S&P 500 Cumulative Advance/Decline

Equal-Weighted S&P 500 and S&P 500 Cumulative Advance/Decline Charts suggesting that a market correction may begin soon, as the S&P 500 cumulative advance/decline line fails to confirm the new all-time highs. Image: Morgan Stanley Research