U.S. Unemployment Breadth and S&P 500
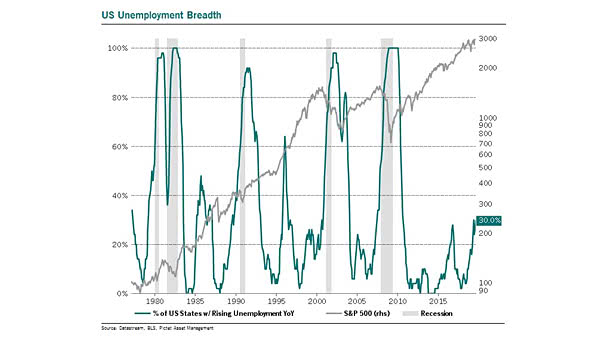
U.S. Unemployment Breadth and S&P 500 Year-over-year, the U.S. unemployment rate is rising in 30% of U.S. states, up from 18% in December 2018. Image: Pictet Asset Management
U.S. Unemployment Breadth and S&P 500 Year-over-year, the U.S. unemployment rate is rising in 30% of U.S. states, up from 18% in December 2018. Image: Pictet Asset Management
S&P 500 Index and Percent of Members Above 200-Day Moving Average The S&P 500 nears its all-time high, but without improved breadth and broader sector participation, the market risks a correction. Rising indexes amid weak breadth often mark an inflection point, hinting at possible market weakness ahead. Image: Bloomberg

S&P 500 Technical Composite A composite of technical breadth measures points to the S&P 500 being overbought, raising the likelihood of a selloff. Image: MarketDesk Research
Bullish Percent Index vs. S&P 500 Index The S&P 500’s rally has reversed extreme bearish sentiment, pushing the number of stocks on bullish buy signals toward 70% and confirming a significant, broad-based improvement in market breadth. Image: Real Investment Advice
S&P 500 with >100 52-Week Highs and >300 10-Day Highs on the Same Day On July 16, 2024, the strong breadth of over 100 S&P 500 stocks hitting 52-week highs and 300 reaching 10-day highs, usually results in S&P 500 higher prices over the next 12 months, with an average gain of 13% since 1980.…
S&P 500 and Percent of S&P 500 Members Above Their 200-Day Moving Average The expansion of market breadth in the U.S. stock market indicates a broader participation of stocks in the market movement, suggesting potential for further upside. Image: Morgan Stanley Research
Nasdaq Composite Index vs. Nasdaq Composite Cumulative Advance/Decline The Nasdaq Composite’s breadth is not great. Image: Morgan Stanley Research
S&P 500 and Percent of World Markets Above their 50-Day Moving Average Historically, oversold conditions in a breadth thrust regime tend to be bullish for U.S. stocks. Image: All Star Charts
NYSE Stocks Advance-Decline Line Market breadth has declined sharply throughout 2022. Image: BofA Global Research
NYSE Stocks Advance-Decline Line The NYSE stocks advance-decline line did not sustain a bullish breakout in late 2021, which suggests weaker breadth. Image: BofA Global Research
% of NYSE Stocks Trading Above Their 200-Day Moving Average Based on the percentage of NYSE stocks above their 200-day moving average, market breadth has weakened. Should investors be worried? Image: BCA Research