Fed – Number of Policy Rate Adjustments
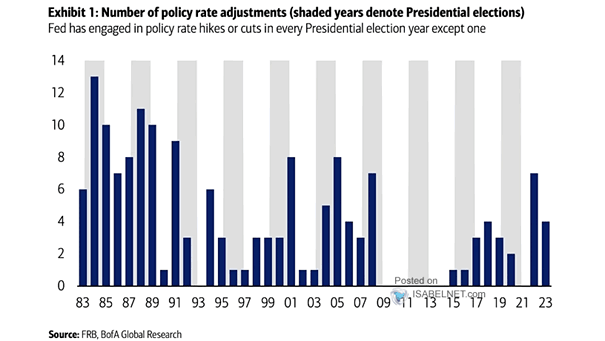
Fed – Number of Policy Rate Adjustments Throughout history, the Federal Reserve has made decisions that are not influenced by the election cycle, as the central bank’s actions are predominantly guided by economic indicators and its dual mandate. Image: BofA Global Research