U.S. Small Cap Fund Flows

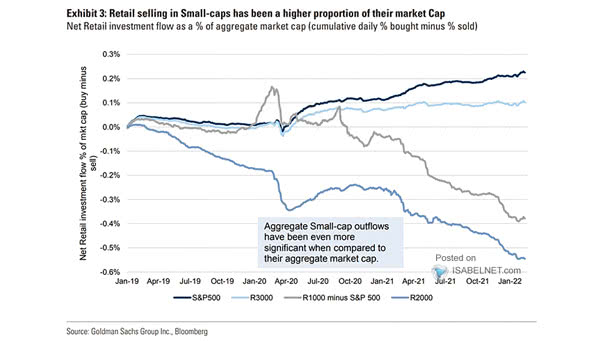
U.S. Small Cap Fund Flows Should investors be bullish on U.S. small caps despite record outflows? Image: Topdown Charts

Small Cap and Value Flows

Small Cap and Value Flows Small-caps and value have seen recent outflows. Image: BofA Global Research

Weekly Tech Equity Fund Flows

Tech Equity Fund Flows Tech stocks saw their largest outflow since December 2018. Should investors dump tech stocks in favor of cyclicals? Image: BofA Global Investment Strategy

Weekly Gold Fund Flows

Weekly Gold Fund Flows This week saw the largest outflow from gold ever, as vaccine optimism soars. Image: BofA Global Investment Strategy

Funds Flow – Fixed Income and Equities

Funds Flow – Fixed Income and Equities Fixed income funds continue to recover, but equity funds experienced 22 weeks of outflows this year. Image: BofA

Global Equity Flows vs. Global Equities vs. Bonds

Global Equity Flows vs. Global Equities vs. Bonds Over the past 12 months, global equities suffer record outflows since the Global Financial Crisis. Image: BofA Global Investment Strategy

GWIM Cash Flows

GWIM Cash Flows This chart shows the largest cash outflow from BofA’s private clients since April 2019, while there has been a lot of cash inflow this year. Image: BofA Global Investment Strategy

Global Flow into Chinese Equity Funds

Global Flow into Chinese Equity Funds Chinese equity funds saw an 11th consecutive week of net outflows. Image: Goldman Sachs Global Investment Research
YTD Flow Winners and Losers

YTD Flow Winners and Losers Equities have seen billions in outflows year-to-date. Image: BofA Global Investment Strategy