Bear Markets – The 2020 Sell-Off vs. History
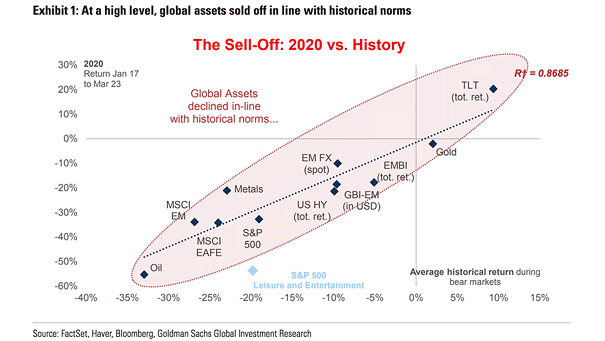
Bear Markets – The 2020 Sell-Off vs. History Global assets declined in-line with historical norms during the coronavirus crisis. Image: Goldman Sachs Global Investment Research
Bear Markets – The 2020 Sell-Off vs. History Global assets declined in-line with historical norms during the coronavirus crisis. Image: Goldman Sachs Global Investment Research
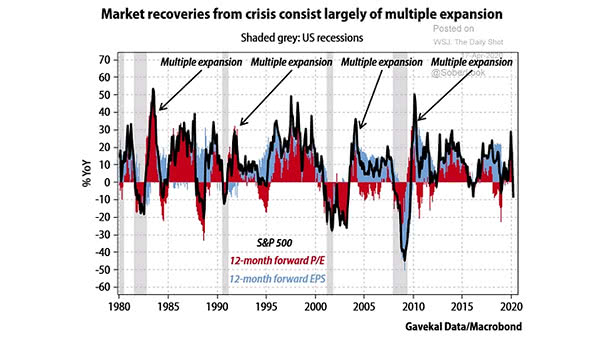
S&P 500 and Market Recoveries Historically, after a crisis, market recoveries came largely from multiple expansion. Image: Gavekal, Macrobond

Equity Market Recoveries (Rise in S&P 500 Compared to Its Lows from the Past 500 Trading Days) Historically, the S&P 500 has rallied at least another 10% following a major crash. Image: Nordea and Macrobond
U.S. High Yield vs. S&P 500 and Time to Recover After Major Market Crashes Historically, credit has recovered faster than equity after major market crashes. Image: BofA Research Investment Committee
Top 15 Worst First Quarters for the Dow Jones Industrial Average The Dow Jones Industrial Average recorded its worst first quarter ever. Historically, the median annual loss was 3.5%. Image: CNBC
S&P 500 Return Last of Month Based on MTD Bond-Equity Performance Historically, pension fund rebalancing into equities has had a mild impact on performance. Image: Deutsche Bank Asset Allocation
S&P 500 and Bear Market Bottom Historically, bear markets tend to retest the bottom either once or twice. Image: Gavekal, Macrobond
Peak to Trough Equity Move Around Past Recessions Historically, the average move in the S&P 500 from peak to trough around past recessions is -32%. Image: J.P. Morgan
S&P 500 Performance and Risk Appetite Indicator This chart suggests that the S&P 500 has historically recovered, after the Risk Appetite Indicator falls below -2. Image: Goldman Sachs Global Investment Research
S&P 500 Performance in Bear Markets Historically, about 70% of bear markets lead to a recession in the United States. Image: CNBC