S&P 500 Returns in Recessions since 1928
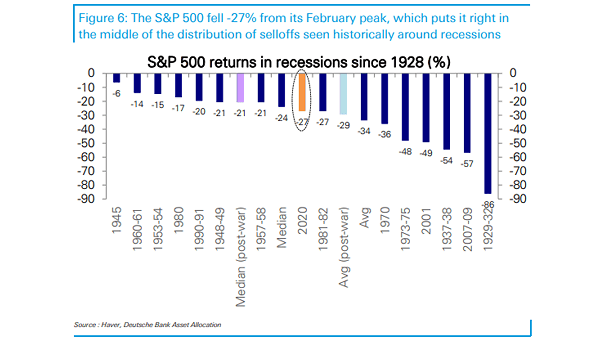
S&P 500 Returns in Recessions since 1928 Currently, the S&P 500 is in the middle of the distribution of selloffs seen historically around previous recessions. Image: Deutsche Bank Asset Allocation
S&P 500 Returns in Recessions since 1928 Currently, the S&P 500 is in the middle of the distribution of selloffs seen historically around previous recessions. Image: Deutsche Bank Asset Allocation
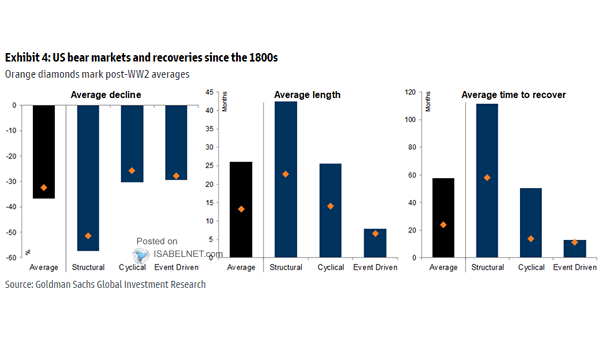
Different Type of Bear Markets Historically, event-driven bear markets see falls of 29% on average, last 9 months and recover within 15 months. Image: Goldman Sachs Global Investment Research

All > 19% S&P 500 Slumps From Record Highs This chart shows all historical S&P500 slumps from record highs since 1957. Image: Hondo Tomasz
S&P 500 and NYSE Down Volume Ratio Four of the past nine days have seen NYSE down volume ratio above 88%. Historically, the S&P 500 rallied every time over the next year, with a median return of 24.3% since 1962. Image: Sentimentrader
S&P 500 Decline and P/E Change in Recessions Historically, following a recession, the S&P 500 fall by a median of 22% from peak to trough and S&P multiples contract by a median of 21%. Image: Goldman Sachs Global Investment Research
S&P 500 Index Performance When Lower First Two Months Historically, when the S&P 500 index was down in January and February, the entire year was down almost 5% on average. Image: LPL Research
Gold Prices during U.S. Recessions Historically, gold prices have performed fairly well on average during U.S. recessions. Image: Nordea and Macrobond
Gold Seasonality Historically, March has been one of the weakest months for gold. Image: Renaissance Macro Research
S&P 500 Over Next 250 Sessions Following 6%+ Drop Historically, when the S&P 500 dropped by 6% or more over the prior two sessions, it was up by 16.7% on average over the course of the next 250 trading days, Image: Of Dollars And Data
S&P 500 Drops More than 2% on a Monday Drops of more than 2% on a Monday have historically been bought in the near term. Image: CNBC