All > 19% S&P 500 Slumps From Record Highs
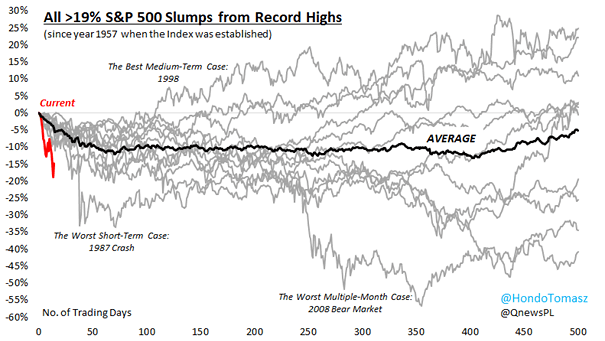
All > 19% S&P 500 Slumps From Record Highs This chart shows all historical S&P500 slumps from record highs since 1957. Image: Hondo Tomasz
All > 19% S&P 500 Slumps From Record Highs This chart shows all historical S&P500 slumps from record highs since 1957. Image: Hondo Tomasz
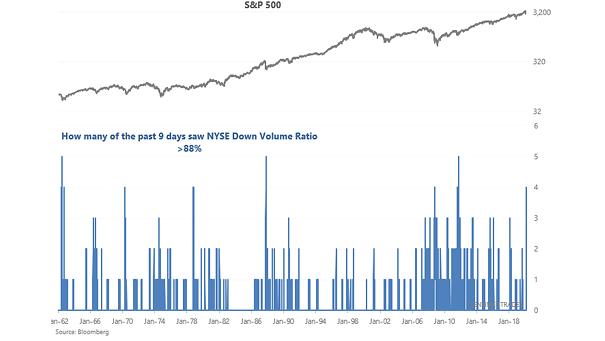
S&P 500 and NYSE Down Volume Ratio Four of the past nine days have seen NYSE down volume ratio above 88%. Historically, the S&P 500 rallied every time over the next year, with a median return of 24.3% since 1962. Image: Sentimentrader

S&P 500 Decline and P/E Change in Recessions Historically, following a recession, the S&P 500 fall by a median of 22% from peak to trough and S&P multiples contract by a median of 21%. Image: Goldman Sachs Global Investment Research
S&P 500 Index Performance When Lower First Two Months Historically, when the S&P 500 index was down in January and February, the entire year was down almost 5% on average. Image: LPL Research
Gold Prices during U.S. Recessions Historically, gold prices have performed fairly well on average during U.S. recessions. Image: Nordea and Macrobond
S&P 500 Over Next 250 Sessions Following 6%+ Drop Historically, when the S&P 500 dropped by 6% or more over the prior two sessions, it was up by 16.7% on average over the course of the next 250 trading days, Image: Of Dollars And Data
S&P 500 Drops More than 2% on a Monday Drops of more than 2% on a Monday have historically been bought in the near term. Image: CNBC
U.S. Market Breadth At the dotcom bubble peak, the percentage of stocks outperforming the S&P 500 was 27% vs. 42% today (the historical average is 48%). Currently, the relative market breadth isn’t as extreme as it was in 2000. Image: Fidelity Investments
Calendar Year Performance During U.S. Presidential Election Years Presidential election years have historically been good for U.S. equities, when an incumbent president winds up winning reelection. Image: BlackRock Investment Institute
S&P 500 Annual Return: Dividends, Earnings Growth and Multiple Expansion In 2019, the S&P 500 rose 31.5%. 26.9% came from multiple expansion, 2.6% from dividends, and 2.0% from earnings growth. Historically, S&P multiples contract or remain flat following years of big multiple expansion. Image: Richardson Wealth
U.S. Prime Age Employment Ratio and Wage Growth Wage growth is sluggish, despite historically low unemployment in the United States. Image: Swedbank Research