Are Fears About an Imminent Recession Overblown?
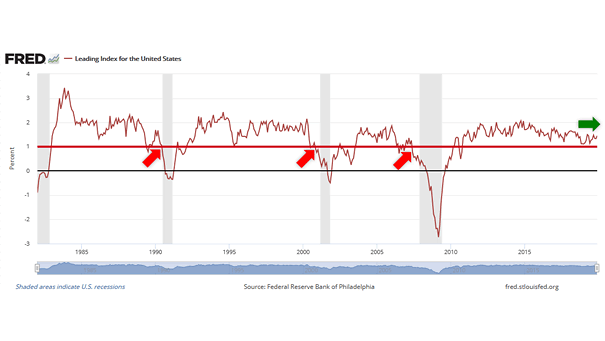
Are Fears About an Imminent Recession Overblown? Historically, a recession is coming when the Leading Index for the United States is below 1. Today, it stands at 1.37. “The leading index for each state predicts the six-month growth rate of the state’s coincident index. In addition to the coincident index, the models include other variables…