S&P 500 Total Returns in Years After 20%-plus Gains
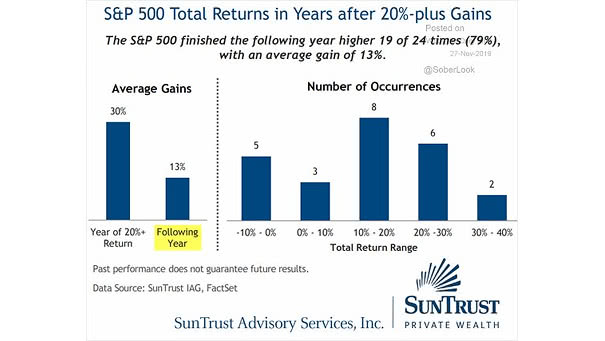
S&P 500 Total Returns in Years After 20%-plus Gains Historically, the S&P 500 has finished higher 79% of the time with an average gain of 13%. Image: Truist
S&P 500 Total Returns in Years After 20%-plus Gains Historically, the S&P 500 has finished higher 79% of the time with an average gain of 13%. Image: Truist
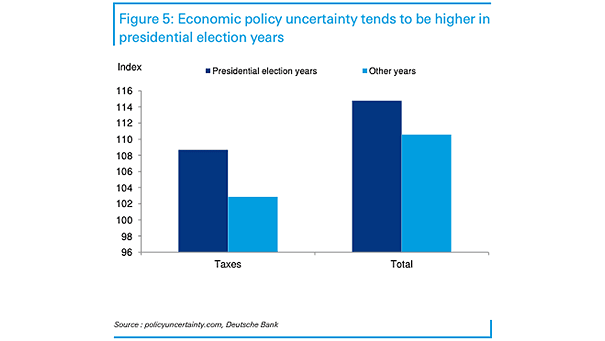
Economic Policy Uncertainty During U.S. Presidential Election Years Chart suggesting that historically, economic policy uncertainty is higher in U.S. presidential election years, particularly uncertainty related to tax policy. Image: Deutsche Bank

Valuation – S&P 500 Forward PE Ratio The forward P/E ratio of the S&P 500 is 19.77 and remains at high level. The historical range is about 15.5 to 17. Image: Bianco Research
Seasonality – 2019 S&P 500 Performance by Month vs. the 1980-2018 Average This year, the S&P 500 seasonality looked different than its historical pattern since 1980. Image: CNBC
MSCI ACWI and S&P 500 Forward P/E Multiple This year, the forward P/E multiple for global equities and for the S&P 500 increased by approximately 24%. Historically, multiples contract or remain flat following years of big multiple expansion. Image: Morgan Stanley Research
S&P 500 Average Returns Since 1926 Historically, in the year following a double-digit gain, there have only been three years where the U.S. stock market has experienced a double-digit decline. Image: Ben Carlson
S&P 500 Average Return in December Historically, the S&P 500 has done well in the second half of December. Image: LPL Research
What Happens The Year After The S&P 500 Gains More Than 30% (Total Return) Historically, the chart shows that the following year has been higher 10 of 12 times and the average return is 15.2%. Image: Ryan Detrick, LPL Financial LLC
Chicago Fed National Financial Conditions Index and S&P 500 Financial conditions remain easy, which is historically bullish for U.S. equities. Image: BofA Global Research
S&P 500 Forward Performance +6 Months Following New All-Time High Since 1950 Historically, there are major falls 5% of time, further gains 82% of time and major gains 21% of time. Image: Strategas