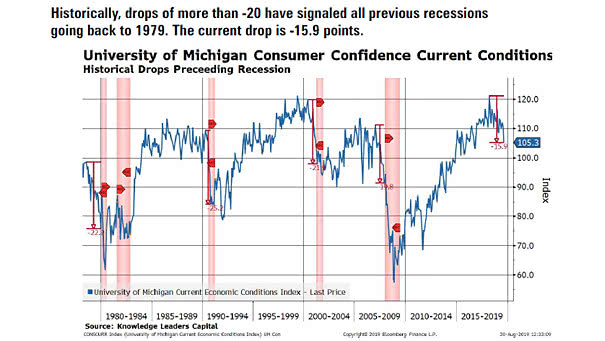
University of Michigan Current Economic Conditions Index and Recessions
University of Michigan Current Economic Conditions Index and Recessions This chart shows that historical drops of more than -20 points in consumer confidence current conditions have signaled recessions since 1979. The current drop stands at -15.9 points. Image: Knowledge Leaders Capital