S&P 500 Forecast for 2020
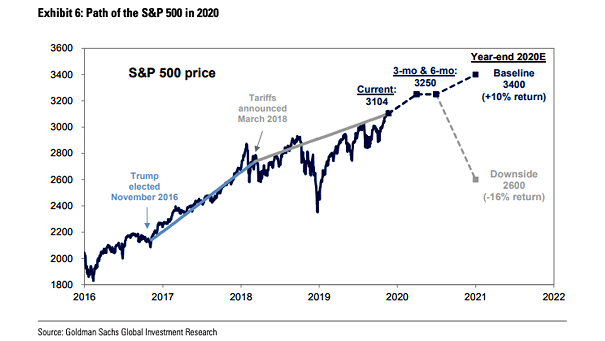
S&P 500 Forecast for 2020 Goldman Sachs forecasts a price-target for the S&P 500 at 3400 by year-end 2020, and a downside scenario at 2600 depending on tariffs and the US election result. Image: Goldman Sachs
S&P 500 Forecast for 2020 Goldman Sachs forecasts a price-target for the S&P 500 at 3400 by year-end 2020, and a downside scenario at 2600 depending on tariffs and the US election result. Image: Goldman Sachs
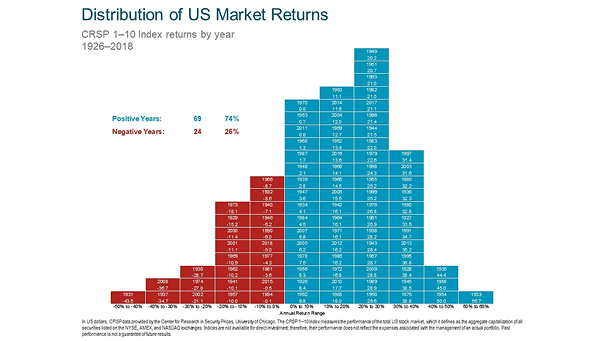
Distribution of U.S. Market Returns Since 1926, annual returns between 20% and 30% are the most common. Year-to-date, the S&P 500 Index has gained 23%. Image: Center of Research in Security Prices

U.S. 10Y-2Y Yield Curve and U.S. High Yield Bonds Chart suggesting that high yield prices are not likely to perform well. Image: Morgan Stanley
Global Gold Production Chart suggesting that gold is heading for a flat supply at best in the coming years, which could further support the price of gold. Image: Bernstein
Bitcoin Volatility The price of Bitcoin exhibits high volatility persistence. Has Bitcoin failed as a means of payment and store of value? Image: Financial Times
MSCI World Index Valuation at Cycle Peaks and Troughs On average, the MSCI World Index currently trades at a price-to-earnings ratio that has marked cyclical peaks in the stock market over the past 50 years. Image: Charles Schwab
Growth and Inflation This chart shows the ISM Index vs. prices paid deviation from the mean since 2009. Currently, the U.S. manufacturing cycle has headed back into recession & deflation. Image: Fidelity Investments
U.S. Rate-Cut Cycles and the U.S. Dollar The U.S. dollar has weakened only once, over the past four U.S. rate-cut cycles. Image: T. Rowe Price
Major Oil Supply Disruptions As a reminder, disruptions in the oil market have always led to higher oil prices. Image: BofA Merrill Lynch Global Research
Effects and Durations of 19 Oil Market Disruptions This table shows that disruptions in the oil market have always led to higher oil prices. Image: PKVerleger, LLC
U.S. ISM Manufacturing Index vs. S&P 500 Chart showing that the S&P 500 continues to price in a strong rebound in the ISM, from 49 to 54 (R = 0.62). Image: Deutsche Bank Global Research