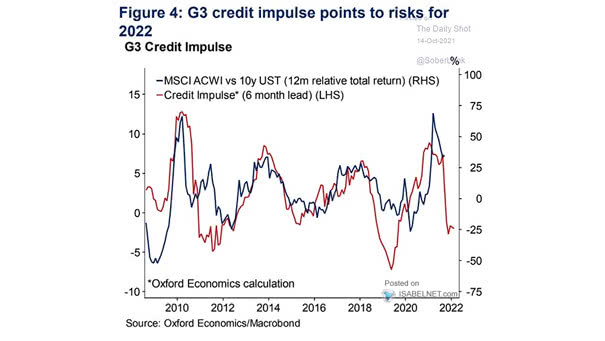
G3 Credit Impulse and MSCI ACWI vs. 10-Year UST (Leading Indicator)
G3 Credit Impulse and MSCI ACWI vs. 10-Year UST (Leading Indicator) Is it time to switch to defensives? Image: Oxford Economics
G3 Credit Impulse and MSCI ACWI vs. 10-Year UST (Leading Indicator) Is it time to switch to defensives? Image: Oxford Economics
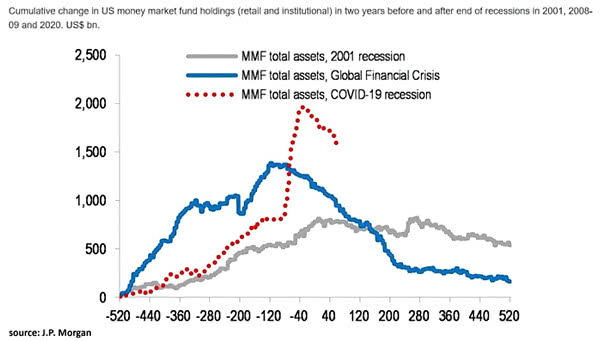
U.S. Money Market Fund Holdings According to J.P. Morgan, the wall of cash may remain very high indefinitely, as defensive assets are delivering their weakest performance. Image: J.P. Morgan

Consolidated Equity Positioning and S&P 500 vs. Cumulative U.S. Equity Fund Flows Equity positioning continues to creep higher, but flows remain very defensive, as equities have seen outflows for the last three weeks. Image: Deutsche Bank Asset Allocation
Weekly Gold Fund Flows Gold funds saw a significant net increase in holding, as investors sought a defensive position after a month of volatility. Image: BofA Global Investment Strategy
S&P 500 and Seasonal Rotation Strategy Sell in May and go away? This chart suggests that a rotation between defensive and cyclical sectors was a much better strategy Image: CFRA, S&P Global
Citi Economic Surprise Index and S&P 500 The Citi Economic Surprise Index has risen sharply, but it has an inconsistent history in terms of its correlation with the S&P 500. It is a cyclical indicator: high readings suggest favouring defensives over cyclicals, and low readings suggest favouring cyclicals over defensives. Image: Renaissance Macro
Gold vs. U.S. 10-Year Real Yield The chart shows the nice correlation between the U.S. 10-year real yield (inverted) and the price of gold as a defensive asset Image: Saxo Bank
Gold vs. Real U.S. Rates The chart shows the nice correlation between real U.S. rates (inverted) and the price of gold as a defensive asset. Image: Richardson Wealth