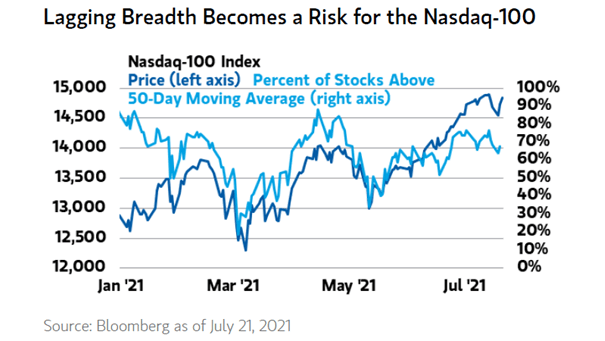
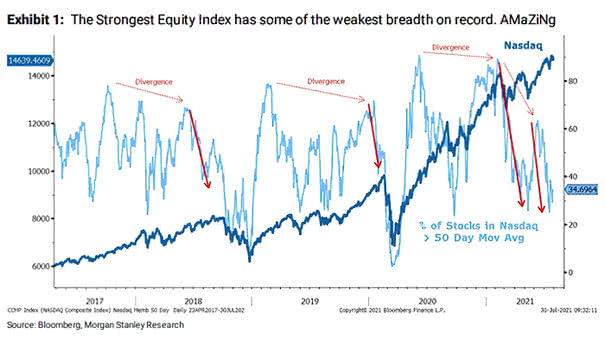
MSCI ACWI – Global Equities Breadth

MSCI ACWI – Global Equities Breadth Global equity market breadth is deteriorating. Is it time to reduce exposure to risk assets? Image: Topdown Charts

Flow – % Share of Rolling Three-Month ETF Inflows

Flow – % Share of Rolling Three-Month ETF Inflows Investors reduced their equity exposure. Over the past 3 months, nearly 50% of all ETF inflows have funneled into HY, IG and Agg bonds. Image: Arbor Research & Trading LLC

MSCI Eurozone vs. MSCI U.S.

MSCI Eurozone vs. MSCI U.S. This chart shows the large divergence between the MSCI Eurozone Index and the MSCI U.S. Index. Is this an opportunity to increase exposure to eurozone equities? Image: Financial Times

U.S. Bond ETFs Top Inflows Record

U.S. Bond ETFs Top Inflows Record In June, investors significantly increased their exposure to bond funds, as weak economic data fuels slowdown worries. U.S. bond ETFs inflows hit $25.4bn. Image: Financial Times