Percentile of Sentiment Indicators since 2009
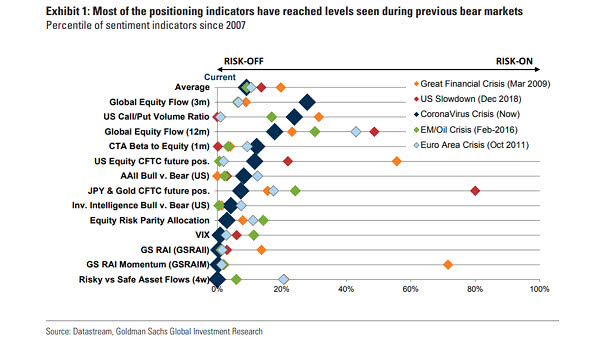
Percentile of Sentiment Indicators since 2009 Most market sentiment indicators are reaching low levels. Image: Goldman Sachs Global Investment Research
Percentile of Sentiment Indicators since 2009 Most market sentiment indicators are reaching low levels. Image: Goldman Sachs Global Investment Research
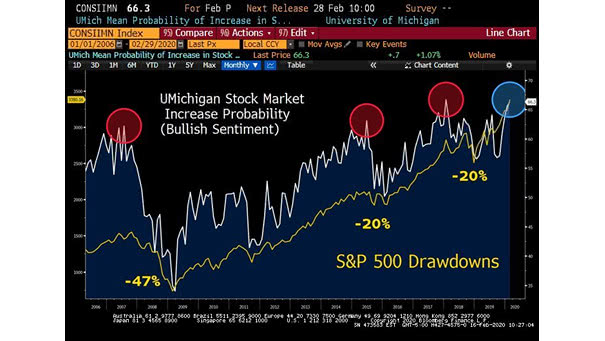
University of Michigan Stock Market Increase Probability Next Year and S&P 500 Drawdowns This chart suggests to remain vigilant on the U.S. stock market, when bullish sentiment is so high. Image: Bloomberg

U.S. AAII Sentiment Survey and S&P 500 This chart shows that market sentiment is important to contrarian investors. Image: Pictet Asset Management
U.S. Consumer Sentiment The University of Michigan Consumer Sentiment Index is more sensitive to financial markets, whereas the Conference Board Index reflects labor market conditions. Image: J.P. Morgan
Home Builder Sentiment Leads Consumer Spending Interesting chart suggesting that the NAHB housing market index leads the change in consumer spending. The latest reading for July suggests that the outlook for the U.S. economy is expected to slow. Image: Dr Thomas Kevin Swift
Weekly AAII Investor Sentiment Survey Bulls push above bears, but when doubt and fear are still present, it does not usually look like a major market top. Image: Reuters
S&P 500 Futures – Massive Pre-market Fear Since 1982 Since 1982, there have been two time periods of this massive pre-market fear: in 2002 and 2008, during the bear market. Image: Sentimentrader
Bitcoin and Nasdaq 100 In recent times, Bitcoin has exhibited a notable correlation with the Nasdaq 100. The decline in Bitcoin’s price has sparked concerns about its effects on the Nasdaq 100 and broader market sentiment. Image: Topdown Charts
S&P 500 and 3-Month VIX Relative to VIX (VIX3M/VIX) The 3-month VIX relative to the VIX closing at an oversold level below 1 is a potentially significant indicator of market sentiment. This can be interpreted as a sign of capitulation and possibly a contrarian bullish signal. Image: BofA Global Research
Risky vs. Safe Assets Fund Flows Positive fund flows into risky assets, as opposed to safe assets, indicate a broader market sentiment in which investors are willing to accept higher risks for potential gains. Image: Goldman Sachs Global Investment Research