Returns for WTI Crude Oil Futures and MSCI Emerging Markets Index
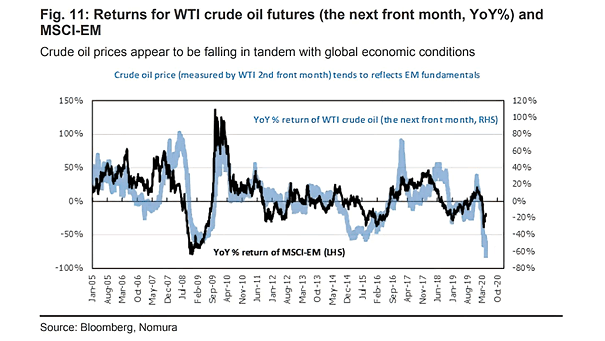
Returns for WTI Crude Oil Futures and MSCI Emerging Markets Index The WTI crude oil price tends to reflects EM fundamentals. Image: Nomura
Returns for WTI Crude Oil Futures and MSCI Emerging Markets Index The WTI crude oil price tends to reflects EM fundamentals. Image: Nomura
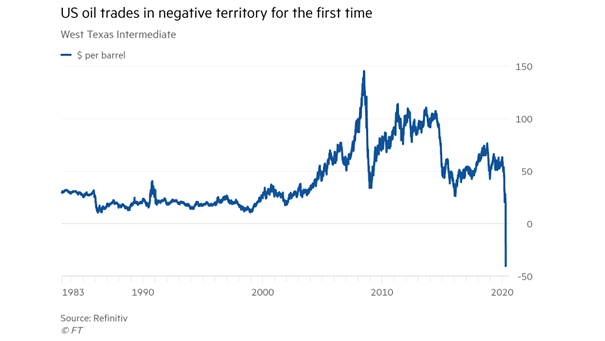
WTI Crude Oil Plunges Below Zero This chart shows the price of WTI crude oil below zero for the first time in history. Image: Financial Times

Conference Board Leading Economic Index (LEI) and S&P 500 This chart suggests that the Conference Board Leading Economic Index doesn’t lead the S&P 500 price performance. Image: Charles Schwab
U.S. Correlation Between GDP and Equity Market This chart shows the correlation between U.S. GDP and U.S. equity market (R² = 0.50). U.S. equity prices suggest U.S. GDP growth of 0.7% YoY in Q3 2020. Image: Deutsche Bank
Valuation – GS Top-Down vs. Consensus Bottom-Up Estimates of 2020 EPS Growth This chart suggests that equity market valuations are too high, as current stock prices do not reflect the scale of earnings declines in a recession. Image: Goldman Sachs Global Investment Research
U.S. Buybacks Goldman Sachs expects buybacks to fall by 50% during 2020 compared with 2019 levels, suggesting slower EPS growth and less support for stock prices. Image: Goldman Sachs Global Investment Research
Implied Trailing 12-Month Buybacks Goldman Sachs expects a sharp decline in buybacks in 2020 and 2021, suggesting less support for stock prices and slower EPS growth. Image: Goldman Sachs Global Investment Research
S&P 500 Index vs. Reported EPS This chart shows the very high correlation between stock prices and earnings since 1871 (R² = 0.97) Image: Fidelity Investments
S&P 500 Index vs. Earnings per Share (EPS) Currently, the S&P 500 Index prices in a 15% decline in EPS. A decline of 33% from 2019 seems more appropriate, according to Goldman Sachs. Image: Jeroen Blokland
Amount of Distressed Bonds Driven by the coronavirus pandemic and the collapse of oil prices, the amount of distressed bonds has surged to the highest level since 2009. Image: Bloomberg