Maximum Drawdown vs. Annual S&P 500 Returns
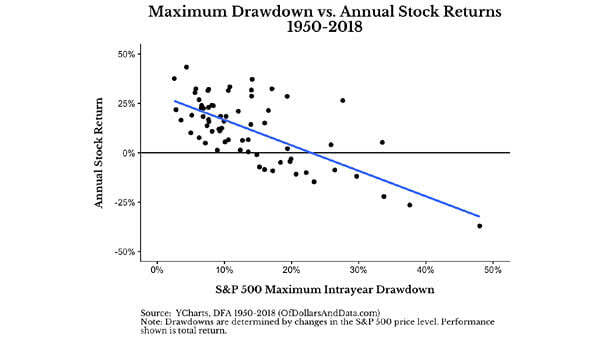
Maximum Drawdown vs. Annual S&P 500 Returns The annual return of the S&P 500 can be positive, even after a large drawdown. Image: Of Dollars And Data
Maximum Drawdown vs. Annual S&P 500 Returns The annual return of the S&P 500 can be positive, even after a large drawdown. Image: Of Dollars And Data
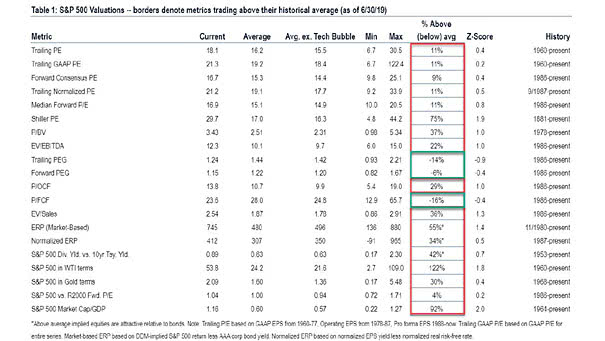
S&P 500 Valuation Above Historical Average The S&P 500 is overvalued on 17 of 20 valuation metrics. You may also like our “Stock Market Valuation.” Image: Bank of America

Correlation Between S&P 500 and U.S. Treasuries This chart shows the correlation between stocks and bonds, which could affect a balanced 60/40 portfolio. Image: Arbor Research & Trading LLC
S&P 500 PE Level vs. Average 12-month Return The chart shows how market valuation affects future equity returns since 1930. You may also like “Why the Stock Market Valuation Matters Before a Recession?“ Image: Richardson Wealth
S&P 500 Equity Index since 1928 This chart puts into perspective the current record levels of the S&P 500. You may also like “The Stock Market Continues to Climb the Wall of Worry.” Image: John Kemp
Margin Debt and S&P 500 This chart shows that margin debt has not recovered from last December’s lows, while the stock market has risen sharply.Usually, it is mostly bullish for stocks, because investors are still fearful. Image: Yardeni Research, Inc.
MSCI ACWI ex-U.S. and S&P 500 Index U.S. equities have significantly outperformed the rest of the world in recent years, but this has not always been the case. You may also like “Trailing 12-month Return Differential between U.S. and non-U.S. Stocks.” Image: ClearBridge Investments
S&P 500 Dividend Yield vs. 10-Year Treasury Yield since 2009 This chart shows the gap between S&P 500 dividend yield and the 10-year Treasury yield since 2009. Keep in mind that investing is not just a competition between stocks and bonds. But for the first time since 2017, the dividend yield on US stocks is equal…
10-Year Treasury minus 1-Year Treasury Yield Spread vs. S&P 500 Returns If history helps us to predict the future, the 10y-1y treasury yield spread suggests low returns ahead for U.S. stocks. After 10 years of a bull market, our stock market forecasting model also shows that the market follows a different path in 2019. Statistically,…
Do You Really Think That, By Buying the S&P 500, You Never Lose Money? Well, even if it is not adjusting for inflation with dividends, this chart is very interesting. That’s the reason why we develop stock market forecasting models. Image: Frank Jurs