U.S. Equities and The World: Earnings Growth vs. Multiple Expansion
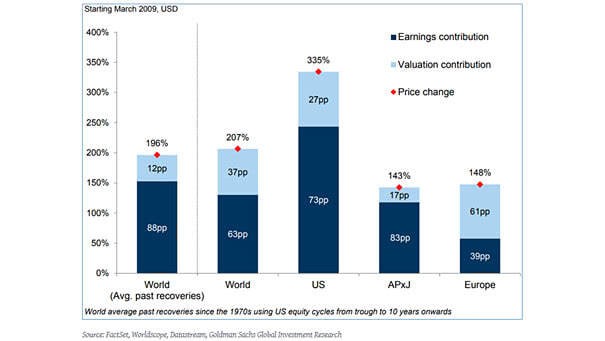
U.S. Equities and The World: Earnings Growth vs. Multiple Expansion Since the 2009 low, the strong performance of the U.S. markets comes from earnings growth (73%) and multiple expansion (27%). You may also like “S&P 500 Return: Earnings Growth vs. Multiple Expansion.” Image: Goldman Sachs Global Investment Research