Global Oil Consumption as a % of GDP and Global Recessions
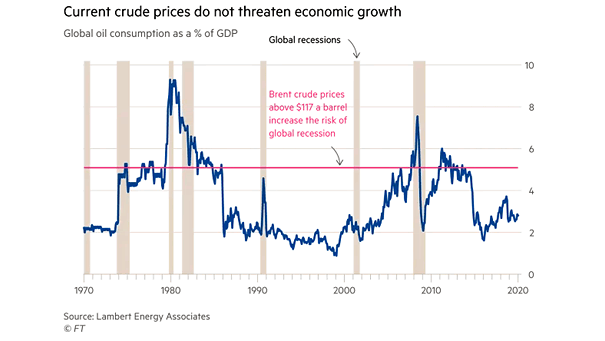
Global Oil Consumption as a % of GDP and Global Recessions Chart suggesting that Brent crude prices need to exceed US$117 to push the global economy into recession. Image: Financial Times
Global Oil Consumption as a % of GDP and Global Recessions Chart suggesting that Brent crude prices need to exceed US$117 to push the global economy into recession. Image: Financial Times
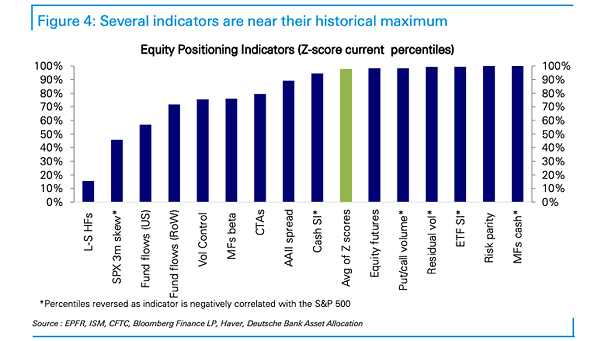
Equity Positioning Indicators Equities positioning has continued to climb, as optimistic investors price in a global growth rebound. Image: Deutsche Bank Asset Allocation

Consolidated Equity Positioning Equities positioning are at their highest level in two years, as optimistic investors price in a global growth rebound. Image: Deutsche Bank Asset Allocation
S&P 500 Valuation Multiples The price-to-sales ratio of the S&P 500 Index suggests that stocks are as expensive as they were during the Internet bubble. The P/E ratio also remains at high level. Image: Tomasz Hońdo
S&P 500 Forecast for 2020 Goldman Sachs forecasts a price-target for the S&P 500 at 3400 by year-end 2020, and a downside scenario at 2600 depending on tariffs and the US election result. Image: Goldman Sachs
Distribution of U.S. Market Returns Since 1926, annual returns between 20% and 30% are the most common. Year-to-date, the S&P 500 Index has gained 23%. Image: Center of Research in Security Prices
Bitcoin vs. Nasdaq This chart highlights the similarities between Bitcoin price movements and Nasdaq during the dotcom bubble. Image: Morgan Stanley Research
U.S. 10Y-2Y Yield Curve and U.S. High Yield Bonds Chart suggesting that high yield prices are not likely to perform well. Image: Morgan Stanley
Global Gold Production Chart suggesting that gold is heading for a flat supply at best in the coming years, which could further support the price of gold. Image: Bernstein
Bitcoin Volatility The price of Bitcoin exhibits high volatility persistence. Has Bitcoin failed as a means of payment and store of value? Image: Financial Times