Demographics – Dow Jones and Generational Peaks

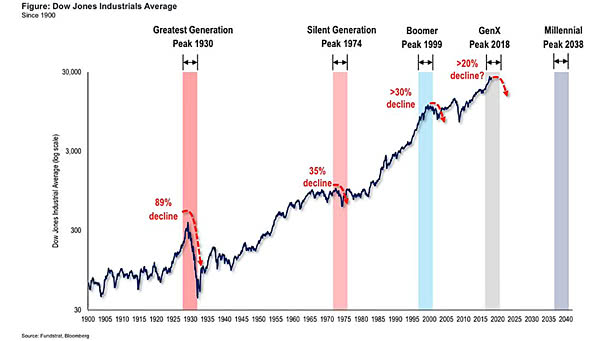
Demographics – Dow Jones and Generational Peaks This chart shows that generational peaks are associated with major market tops. GenX peaked in 2018 and Millennials don’t peak until 2038. Image: Fundstrat Global Advisors, LLC

Trade War and Financial Conditions Index

Trade War and Financial Conditions Index The trade war has tightened the Goldman Sachs FCI by about 60bp cumulatively. The Goldman Sachs Financial Conditions Index (FCI) is a weighted sum of a long-term corporate yield, a short-term bond yield, the exchange rate, and a stock market variable. Image: Goldman Sachs Global Investment Research

A Hall of Mirrors in Monetary Policy?

A Hall of Mirrors in Monetary Policy? This chart suggests a feedback loop between bond market pricing and central bank decisions. Image: Goldman Sachs Global Investment Research

U.S. Equities and The World: Earnings Growth vs. Multiple Expansion

U.S. Equities and The World: Earnings Growth vs. Multiple Expansion Since the 2009 low, the strong performance of the U.S. markets comes from earnings growth (73%) and multiple expansion (27%). You may also like “S&P 500 Return: Earnings Growth vs. Multiple Expansion.” Image: Goldman Sachs Global Investment Research

S&P 500 Cash Return Yield by Sector and Region

S&P 500 Cash Return Yield by Sector and Region Currently, the S&P 500 cash return yield (buybacks + dividends) is 5.2%, the highest since 2011. That’s much more than Europe, Japan and emerging markets. Image: Fundstrat Global Advisors, LLC

“Ken Fisher: Thinking in Ways That Others Do Not, with John Tamny”

“Ken Fisher: Thinking in Ways That Others Do Not, with John Tamny” Great interview of Ken Fisher on: coastal redwoods, dikes and climate change, efficient markets, quantitative easing (QE) vs. inflation, humans as a group are slow to learn, recessions, Fed and interest rates, why philanthropy is bad and immoral, and why inequality is a good…

Gold Has Crushed the S&P 500 So Far Since 2000

Gold Has Crushed the S&P 500 So Far Since 2000 Gold has returned a great 345.30 percent, while the S&P 500 has returned 146.57 percent since 2000. Keep in mind that Gold has beaten the US stock market over multiple time periods Historically, Gold has also had a strong negative correlation with the US stock…

Lumber Prices Are a Great Leading Indicator of Future Earnings

Lumber Prices Are a Great Leading Indicator of Future Earnings This chart suggests that lumber prices give a good forecast of where the stock market is going. When lumber prices fall over a 12-month period, then EPS follows 6 months later. Although there is no immediate recession on the horizon, a market downturn is possible. Image:…