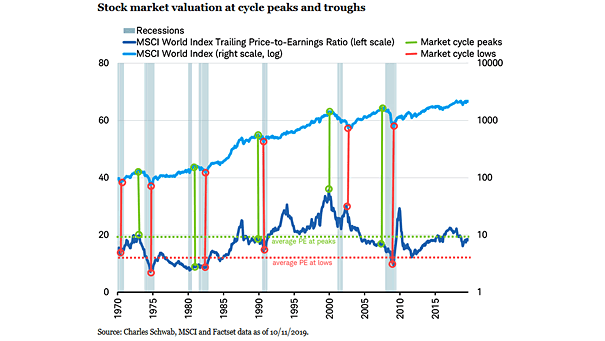
MSCI World Index Valuation at Cycle Peaks and Troughs

MSCI World Index Valuation at Cycle Peaks and Troughs On average, the MSCI World Index currently trades at a price-to-earnings ratio that has marked cyclical peaks in the stock market over the past 50 years. Image: Charles Schwab
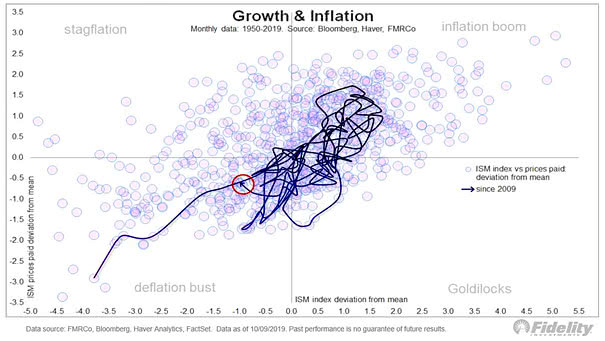
Growth and Inflation

Growth and Inflation This chart shows the ISM Index vs. prices paid deviation from the mean since 2009. Currently, the U.S. manufacturing cycle has headed back into recession & deflation. Image: Fidelity Investments

Major Oil Supply Disruptions

Major Oil Supply Disruptions As a reminder, disruptions in the oil market have always led to higher oil prices. Image: BofA Merrill Lynch Global Research

U.S. ISM Manufacturing Index vs. S&P 500

U.S. ISM Manufacturing Index vs. S&P 500 Chart showing that the S&P 500 continues to price in a strong rebound in the ISM,  from 49 to 54 (R = 0.62). Image: Deutsche Bank Global Research

Estimated Tariff Impact on Core Inflation

Estimated Tariff Impact on Core Inflation President Trump’s decision to increase the tariff rate will lead to a greater boost to U.S. consumer prices. Image: Goldman Sachs Global Investment Research

S&P 500 Forecast for 2019

S&P 500 Forecast for 2019 Goldman Sachs is holding its year-end price-target for the S&P 500 at 3100, and its downside scenario at 2620 (as of August 23, 2019). Image: Goldman Sachs Global Investment Research

Gold Sentiment at Annual High

Gold Sentiment at Annual High The gold price ‘risk radar’ index is flashing red (-2.1 standard deviations). Image: Sentix, Bloomberg Finance L.P.

Strong Dollar and Imports

Strong Dollar and Imports The chart shows that a stronger dollar depresses goods prices via imports. Image: Deutsche Bank Global Research