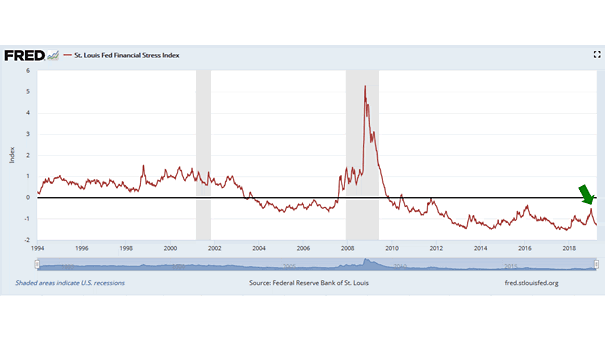
St. Louis Fed Financial Stress Index
St. Louis Fed Financial Stress Index Before a coming recession, also watch the St. Louis Fed Financial Stress Index for forecasting the future. It uses 18 weekly data series to measure financial stress in the market: seven interest rate series, six yield spreads and five other indicators. Each of these variables captures some aspect of financial stress.…