S&P 500 Adds and Drops
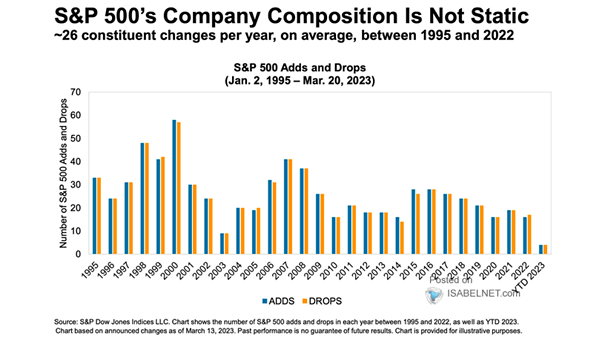
S&P 500 Adds and Drops The turnover in the S&P 500 is relatively high, with an average rate of about 4% per year. Image: S&P Dow Jones Indices
S&P 500 Adds and Drops The turnover in the S&P 500 is relatively high, with an average rate of about 4% per year. Image: S&P Dow Jones Indices
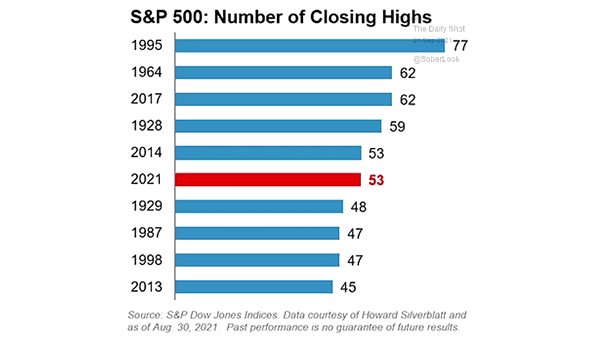
S&P 500 – Number of Closing Highs Will the S&P 500 break the all-time record of 77 new highs this year? Image: S&P 500 Dow Jones Indices

Returns in the S&P Global BMI (Broad Market Index) Since 1995 Market returns in November were very high. Could investors see a Santa Claus rally? Image: S&P Dow Jones Indices
U.S. Stock Market Performance During U.S. Presidential Election Years Chart showing the average performance of the Dow Jones Industrial Average during U.S. presidential election years, since 1900. Image: Wells Fargo Investment Institute
Stock Market Around First Rate Cut: Recession vs. No Recession The chart shows that the Dow Jones Industrial Average reacts positively to Fed first rate cuts. Image: Ned Davis Research
Forward Performance Following First Fed Funds Rate Cuts After first Fed rate cut, the S&P 500 performance is quite attractive on average when no recession. You may also like “Dow Jones Industrial Average Around First Fed Rate Cut.” Image: Strategas